


Cut through messy shapefiles, CSVs, and satellite tiles—Python for geospatial data analysis turns location noise into insights you can ship straight from a notebook.
Python owns the modern geospatial workflow because its ecosystem covers every step. Core tools such as GeoPandas, Shapely, Rasterio, Fiona, PyProj, and Rtree keep data clean and spatially aware. Analytical heavy hitters—including PySAL, OSMnx, xarray with rioxarray, and GeoAlchemy2—push deeper into modeling and storage. Visualization favorites like Folium, Plotly, and Geoplot finish the story.
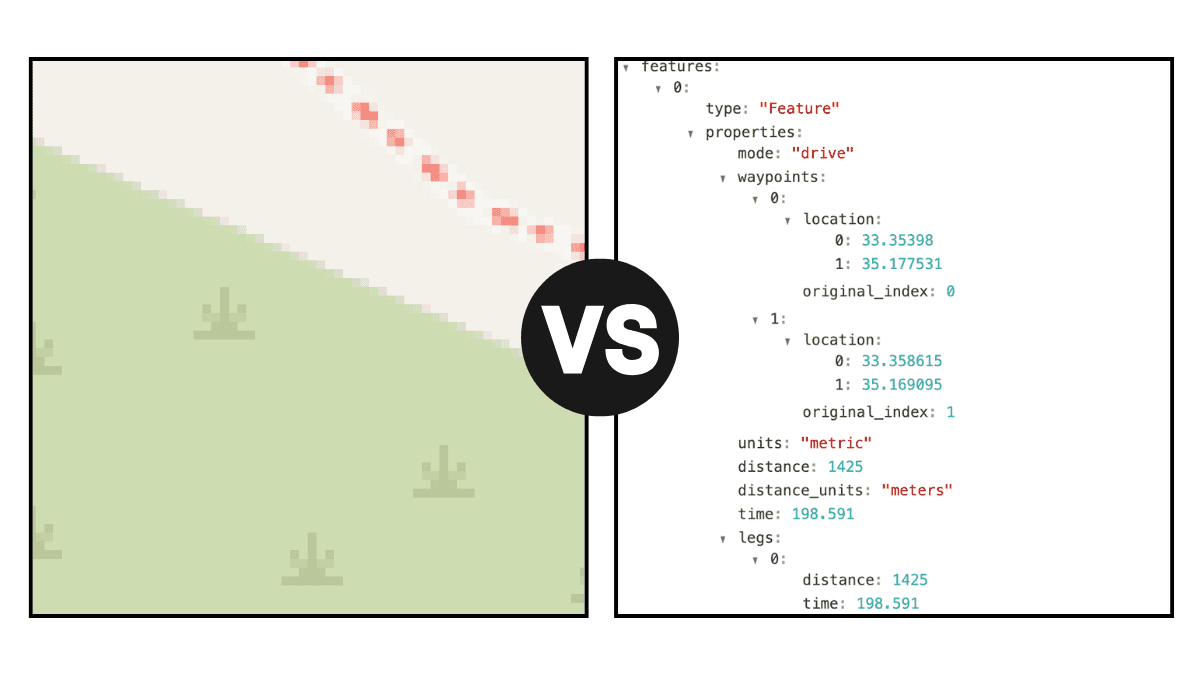
This guide shows how all 12 libraries lock together with Geoapify APIs so you can ingest, enrich, analyze, and publish spatial insight faster.
Next we’ll revisit what geospatial data really means, dive into the libraries grouped by role—data access, geometry operations, advanced analysis, visualization—and wrap with a hands-on project that taps Geoapify’s geocoding and mapping services. Each code block includes setup notes so you can follow along even if Python’s data stack is new territory.
On this page
What Is Geospatial Data?
Geospatial data describes anything with a location component—coordinates, addresses, boundaries, or geometries that anchor information to the Earth. You’ll typically encounter it in two main flavors:
- Vector data stores discrete features such as points (address locations), lines (road centerlines), and polygons (city limits). Attribute tables capture details like population counts or zoning codes alongside the geometry.
- Raster data captures continuous coverage—think satellite imagery, digital elevation models, or population density grids—where every pixel carries a value tied to a precise spot.
Most projects combine both types. For example, intersect a polygon of a delivery zone with points from a customer database and overlay a raster of flood risk to prioritize inspections. If you need a deeper primer, bookmark the upcoming Geospatial Analytics Guide for workflow strategies and Geospatial Data Types for detailed format comparisons.
By grounding your analysis in well-structured geospatial data, Python libraries can unlock spatial joins, buffering, proximity analysis, and map production without switching tools.
Top 12 Python Libraries for Geospatial Data Analysis (Quick Comparison)
| Library | Description | When to use it |
|---|---|---|
| 1. GeoPandas | Pandas-style tabular tooling with geometry-aware columns for vector data. | - Cleaning tabular datasets with geometry columns - Running spatial joins and dissolves - Exporting shapefiles/GeoJSON without leaving Python |
| 2. Fiona | Lightweight GDAL wrapper focused on vector file I/O. | - Streaming large GeoJSON/Shapefile datasets - Inspecting metadata before ingesting - Writing clean exports for other teams |
| 3. Rasterio | Pythonic raster reader/writer with strong CRS support. | - Clipping or mosaicking DEMs and imagery - Reprojecting rasters to match analysis CRS - Preparing terrain tiles for dashboards |
| 4. PyProj | High-accuracy CRS definitions and coordinate transformations (PROJ bindings). | - Validating CRS definitions and EPSG codes - Transforming coordinates outside GeoPandas - Building precise datum-shift pipelines |
| 5. Rtree | Spatial indexing powered by libspatialindex. | - Accelerating nearest-neighbor lookups - Spatially filtering large POI collections - Powering “what’s nearby” search features |
| 6. Folium | Leaflet maps generated directly from Python notebooks. | - Sharing interactive prototypes from notebooks - Building lightweight web-ready maps - Visualizing POIs, iso-lines, or routes quickly |
| 7. Plotly | Interactive, publication-quality charts and mapbox layers. | - Crafting interactive dashboards with hover cards - Embedding map visuals into executive reports - Combining charts and mapbox layers |
| 8. GeoAlchemy2 | SQLAlchemy extension for PostGIS geometry/geography types. | - Persisting geometries inside PostGIS - Running spatial SQL from Python services - Keeping ORM models geometry-aware |
| 9. PySAL | Spatial statistics & econometrics toolkit. | - Measuring spatial autocorrelation (Moran’s I) - Detecting hotspots and clusters - Running spatial regression models |
| 10. OSMnx | Download, analyze, and visualize street networks from OpenStreetMap. | - Downloading walk/bike/drive street networks - Computing centrality and routing metrics - Comparing networks with travel-time polygons |
| 11. xarray + rioxarray | Labeled multidimensional arrays with geospatial CRS awareness. | - Working with time-series rasters/climate grids - Clipping or masking multidimensional arrays - Reprojecting datasets while preserving metadata |
| 12. GeoPlot + Contextily | High-quality static maps with basemap layers. | - Producing publication-ready static maps - Overlaying basemaps beneath GeoPandas layers - Styling figures for reports and slide decks |
1. GeoPandas: Your Vector Analysis Workhorse
GeoPandas is an open-source Python library that makes working with geospatial data feel as natural as wrangling spreadsheets. It extends familiar pandas data structures with location awareness so you can treat vector-based features (points, lines, polygons) as rows in a table—while keeping geometry operations a method call away. Under the hood it blends the strengths of pandas (tabular analytics), Shapely (geometry engine), Fiona (file I/O), and Matplotlib (plotting) to deliver a single entry point for vector data.
Key features
| Feature | What it unlocks | Docs |
|---|---|---|
GeoSeries / GeoDataFrame | Store geometry alongside attributes with table-like tooling. | GeoSeries, GeoDataFrame |
| File I/O helpers | Read and write Shapefile, GeoJSON, GPKG, or PostGIS layers in one line. | gpd.read_file(), GeoDataFrame.to_file() |
| Geometry operations | Buffer, intersect, overlay, and measure distances without leaving Python. | GeoSeries.buffer(), overlay(), sjoin() |
| CRS management | Keep projects aligned by transforming coordinate systems on the fly. | GeoDataFrame.to_crs(), GeoSeries.crs |
| Visualization | Spin up static or interactive maps for QA and storytelling. | GeoDataFrame.plot(), GeoDataFrame.explore() |
| Spatial joins | Merge datasets by relationships like “point within polygon” or “road intersects service area.” | geopandas.sjoin() |
Here’s a practical GeoPandas workflow that talks directly to the Geoapify Places API, reprojects the results for metric analysis, and visualizes hotspots. It pulls restaurant POIs within 2 km of Berlin’s center, buffers each location by 1 km, and calculates how many competitors fall inside every catchment so you can spot high-density clusters:
import os
import requests
import geopandas as gpd

API_KEY = os.environ.get("GEOAPIFY_API_KEY")
if not API_KEY:
    raise RuntimeError("Set the GEOAPIFY_API_KEY environment variable")

# 1. Fetch restaurants within 2km of Berlin center
params = {
    "categories": "catering.restaurant",
    "filter": "circle:13.4050,52.5200,2000",
    "limit": 200,
    "apiKey": API_KEY,
}
resp = requests.get("https://api.geoapify.com/v2/places", params=params)
data = resp.json()

# 2. Convert to GeoDataFrame (WGS84, EPSG:4326)
gdf = gpd.GeoDataFrame.from_features(data["features"], crs="EPSG:4326")

# 3. Reproject to a projected CRS (UTM Zone 33N, meters)
gdf_utm = gdf.to_crs(epsg=32633)

# 4. Build a 1 km buffer around each restaurant
buffers = gdf_utm.copy()
buffers["geometry"] = buffers.buffer(1000)  # 1000 meters

# 5. Spatial join: how many restaurants fall within each buffer
joined = gpd.sjoin(gdf_utm, buffers, predicate="within")
density = joined.groupby(joined.index_right).size()

# 6. Attach density counts back to restaurants
gdf_utm["nearby_restaurants"] = density.values

# 7. Inspect results
print(gdf_utm[["name", "nearby_restaurants"]].head())

# (Optional) Plot restaurants, sized by density
ax = gdf_utm.plot(
    column="nearby_restaurants",
    cmap="OrRd",
    legend=True,
    figsize=(8, 8),
    markersize=50,
    alpha=0.7
)
ax.set_title("Restaurant density within 1 km (Berlin center)")
After running the script you’ll get a table showing how many restaurants sit inside each 1 km buffer and an optional choropleth map sized by local density—perfect for site selection or competitive analysis.
Try it now
- Create a virtual environment (
python3 -m venv .venvon macOS/Linux orpy -m venv .venvon Windows).- Activate it (
source .venv/bin/activateon macOS/Linux,.venv\Scripts\activateon Windows).- Install requirements:
pip install geopandas requests matplotlib.- Export your Geoapify key (
export GEOAPIFY_API_KEY=...orsetx GEOAPIFY_API_KEY ...); the script reads it from the environment. Sign up on Geoapify and get a free API key.- Run the script in a notebook or REPL to see the density table and optional map.
2. Fiona: Reliable Vector I/O
Fiona is the vector file Input/Output library that keeps GeoPandas humming behind the scenes. It wraps GDAL/OGR in a friendly Python API so you can open, inspect, filter, and export formats such as Shapefile, GeoJSON, GeoPackage, and PostGIS without touching C++ bindings. Any time gpd.read_file() or to_file() runs under the hood, Fiona is carrying the load.
Why teams rely on Fiona
| Capability | What it solves | Docs |
|---|---|---|
| Simple file access | Iterate over very large datasets lazily instead of loading everything into memory. | fiona.open() |
| Driver support | Read/write dozens of formats (Shapefile, GeoJSON, GPKG, FlatGeobuf, PostGIS). | Supported drivers |
| Metadata handling | Inspect CRS, schema, and driver metadata before ingesting into GeoPandas. | Collection metadata |
| Streaming transforms | Reproject or filter features on the fly as you stream them from disk or cloud storage. | fiona.transform |
| GeoJSON pipelines | Write clean GeoJSON payloads that feed directly into Geoapify APIs, Static Maps, or Map Tiles. | Collection.write() |
The snippet below shows how Fiona pairs with Geoapify’s Isochrone API: fetch a travel-time polygon as GeoJSON, inspect the metadata, and optionally export it to a GeoPackage for analysis or sharing.
import requests, fiona
from fiona.crs import CRS  # optional, but nice for explicit CRS

API_KEY = "YOUR_API_KEY" # Sign up for free at https://www.geoapify.com/ and replace with your Geoapify API key.

# Fetch a 15-minute driving isochrone around Berlin
params = {"lat": 52.52, "lon": 13.405, "type": "time", "mode": "drive", "range": 900, "apiKey": API_KEY}
isojson = requests.get("https://api.geoapify.com/v1/isoline", params=params, timeout=30).json()

# Assume polygon isoline; extract properties/geometry from the API response
features = isojson["features"]
# Build a schema that matches the GeoJSON properties and geometry type
# (You can introspect the first feature)
geom_type = features[0]["geometry"]["type"]          # e.g., 'Polygon' or 'MultiPolygon'
props = features[0].get("properties", {})            # dict of properties
schema = {
    "geometry": geom_type,
    "properties": {k: "str" if isinstance(v, str) else "float" if isinstance(v, float) else "int"
                   for k, v in props.items()}
}

# Write GeoJSON with Fiona
with fiona.open(
    "berlin_drive_15min_fiona.geojson",
    mode="w",
    driver="GeoJSON",
    schema=schema,
    crs=CRS.from_epsg(4326)  # Geoapify isolines are in WGS84
) as sink:
    sink.writerecords(features)

# Read it back
with fiona.open("berlin_drive_15min_fiona.geojson", "r") as src:
    print("Driver:", src.driver)     # 'GeoJSON'
    print("Features:", len(list(src)))
This workflow keeps your Geoapify response reusable—Fiona streams the GeoJSON, exposes CRS/schema metadata, and then writes a GeoPackage for colleagues who prefer desktop GIS tools.
Try it now
- Reuse the virtual environment from earlier or create one with
python3 -m venv .venv(py -m venv .venvon Windows).- Install dependencies:
pip install fiona requests(addgeopandasif you plan to continue analysis).- Set the
GEOAPIFY_API_KEYenvironment variable or edit the script with your key (keep it private). Sign up on Geoapify and get a free API key.- Save as
fiona_isoline.pyand run it; inspect the console output and the generated GeoJSON/GPKG files.- Load the exported boundary into Geoapify’s Static Maps or Maps API playground to visualize the reachable area.
3. Rasterio: Raster Analysis Without the Headaches
Rasterio brings GDAL’s raster toolkit into a clean Pythonic API. Think of it as GeoPandas for pixel grids—perfect for working with digital elevation models (DEMs), satellite imagery, or any GeoTIFF you need to reproject, clip, or summarize. It pairs well with Geoapify because you can intersect raster insights (elevation, land cover, heatmaps) with polygons returned by Geoapify APIs.
Why Rasterio stays on the short list
| Capability | What it solves | Docs |
|---|---|---|
| Raster I/O | Read/write GeoTIFF, COG, IMG, and more with minimal boilerplate. | rasterio.open() |
| CRS & reprojection | Warp rasters into the projection your workflow expects. | rasterio.warp.reproject |
| Windowed reads | Stream only the pixels you need to keep memory usage low. | DatasetReader.read() |
| Vector masks | Clip rasters using polygons from Maps APIs. | rasterio.mask.mask |
| Statistics & visualization | Compute band stats, hillshades, or quick plots for QA. | rasterio.plot.show |
The example below downloads a public SRTM tile, requests a 15-minute drive-time polygon from Geoapify’s Isoline API, clips the DEM to that area, and calculates mean elevation—handy when you want to understand terrain within a service catchment.
import os
import gzip
import json
import requests
from pathlib import Path

import rasterio
from rasterio.mask import mask
from shapely.geometry import shape, mapping

API_KEY = "YOUR_API_KEY" # Sign up for free at https://www.geoapify.com/ and replace with your Geoapify API key.

# 1) Download SRTM tile (HGT)
data_dir = Path("data")
data_dir.mkdir(exist_ok=True)
zip_path = data_dir / "N52E013.hgt.gz"
if not zip_path.exists():
    resp = requests.get(
        "https://s3.amazonaws.com/elevation-tiles-prod/skadi/N52/N52E013.hgt.gz",
        timeout=60,
    )
    resp.raise_for_status()
    zip_path.write_bytes(resp.content)

# Decompress .hgt
hgt_path = data_dir / "N52E013.hgt"
if not hgt_path.exists():
    with gzip.open(zip_path, "rb") as src, hgt_path.open("wb") as dst:
        dst.write(src.read())

# 2) Get 15-minute drive-time polygon
params = {"lat": 52.52, "lon": 13.405, "type": "time", "mode": "drive", "range": 900, "apiKey": API_KEY}
isojson = requests.get("https://api.geoapify.com/v1/isoline", params=params, timeout=30).json()
polygon = shape(isojson["features"][0]["geometry"])  # shapely geometry

# 3) Clip DEM to isochrone
with rasterio.open(hgt_path) as src:
    # Use GeoJSON-like dicts for mask:
    out_image, out_transform = mask(src, [mapping(polygon)], crop=True)
    out_meta = src.meta.copy()

    # IMPORTANT: write as GeoTIFF, not HGT; update dimensions/transform
    out_meta.update({
        "driver": "GTiff",
        "height": out_image.shape[1],
        "width":  out_image.shape[2],
        "transform": out_transform,
        # Optional niceties:
        "compress": "deflate",
        "tiled": True
    })

    # Mean elevation ignoring masked areas
    # (mask() returns a masked array; use .mask to ignore outside region)
    mean_elev = float(out_image[out_image != src.nodata].mean())
    print(f"Mean elevation within 15-minute drive: {mean_elev:.1f} m")

# 4) Save clipped DEM as GeoTIFF
clipped_path = data_dir / "berlin_isochrone_elevation.tif"
with rasterio.open(clipped_path, "w", **out_meta) as dest:
    dest.write(out_image)

with rasterio.open(clipped_path) as src:
    array = src.read(1)  # first band

    plt.imshow(array, cmap="terrain", vmin=0, vmax=100)  # fix scale 0–100
    cbar = plt.colorbar(label="Elevation (m)")
    cbar.set_ticks([0, 20, 40, 60, 80, 100])  # optional: custom ticks
    plt.title("Elevation within 15-min drive area (Berlin)")
    plt.show()

print(f"Clipped DEM written to {clipped_path}")
This pattern lets you enrich Geoapify polygons with terrain stats before feeding them to notebooks, BI dashboards, or downstream routing models.
Try it now
- Reuse your existing virtual environment or create one with
python3 -m venv .venv(py -m venv .venvon Windows).- Install dependencies:
pip install rasterio shapely requests(Rasterio wheels are available for most platforms).- Export
GEOAPIFY_API_KEY(or inject it via.env) before running the script.- Save the snippet as
rasterio_isochrone.py; run it to download the DEM, clip the raster, and print the mean elevation.- Open the generated GeoTIFF in QGIS or render it with
rasterio.plot.show()for a quick sanity check.
4. PyProj: Coordinate Reference Systems Made Simple
PyProj provides Python bindings to the PROJ library, giving you precise control over coordinate reference system (CRS) definitions, transformations, and datum shifts. While GeoPandas hides most reprojection details, PyProj is the tool you reach for when you need explicit pipelines, dynamic transformations, or to validate that Geoapify outputs align with local projection standards.
When PyProj shines
| Need | What PyProj delivers | Docs |
|---|---|---|
| Identify CRS codes | Look up EPSG IDs, proj strings, or WKT definitions on the fly. | pyproj.CRS |
| Transform coordinates | Convert single points or bulk arrays between coordinate systems. | pyproj.Transformer |
| Validate metadata | Confirm Geoapify responses or third-party datasets declare the expected CRS. | CRS.to_epsg() |
| Work offline | Reference the bundled PROJ database when network access is restricted. | pyproj.database |
| Build pipelines | Chain datum shifts and projections for high-accuracy work. | Transformer.from_pipeline |
The following example geocodes a list of Berlin landmarks via the Geoapify Geocoding API, then uses PyProj to transform WGS84 coordinates into Web Mercator (EPSG:3857) for tile-based mapping, and into the local UTM zone (EPSG:32633) for metric buffering.
import os
import requests
import pandas as pd
from pyproj import CRS, Transformer

API_KEY = os.environ.get("GEOAPIFY_API_KEY")
if not API_KEY:
    raise RuntimeError("Set the GEOAPIFY_API_KEY environment variable")

addresses = [
    "Brandenburg Gate, Berlin",
    "Museum Island, Berlin",
    "Berlin Central Station",
]

# 1. Geocode addresses with Geoapify (returns WGS84 coordinates)
results = []
for query in addresses:
    params = {"text": query, "format": "json", "apiKey": API_KEY}
    resp = requests.get("https://api.geoapify.com/v1/geocode/search", params=params, timeout=15)
    resp.raise_for_status()
    hit = resp.json()["results"][0]
    results.append({
        "query": query,
        "lat": hit["lat"],
        "lon": hit["lon"],
    })

df = pd.DataFrame(results)
print(df)

# 2. Prepare CRS objects
crs_wgs84 = CRS.from_epsg(4326)
crs_web_mercator = CRS.from_epsg(3857)
crs_utm33 = CRS.from_epsg(32633)

# 3. Build transformers (always use `always_xy=True` for lon/lat order)
transformer_web = Transformer.from_crs(crs_wgs84, crs_web_mercator, always_xy=True)
transformer_utm = Transformer.from_crs(crs_wgs84, crs_utm33, always_xy=True)

# 4. Apply transformations
x3857, y3857 = transformer_web.transform(df["lon"].values, df["lat"].values)
xutm, yutm = transformer_utm.transform(df["lon"].values, df["lat"].values)

df["x_3857"] = x3857
df["y_3857"] = y3857
df["x_utm"] = xutm
df["y_utm"] = yutm

print(df[["query", "x_3857", "y_3857", "x_utm", "y_utm"]])
With a few lines of PyProj you can confirm Geoapify geocodes align with the projection your mapping or analytics stack expects, preventing subtle misalignment issues before they hit production.
Try it now
- Create or reuse your virtual environment (
python3 -m venv .venv/py -m venv .venv).- Install dependencies:
pip install pyproj pandas requests.- Export
GEOAPIFY_API_KEYand run the script. Compare the 3857/UTM coordinates to ensure they fall within expected ranges.- Feed the transformed coordinates into Geoapify Static Maps, Tiles, or any local analysis that requires metric units.
5. Rtree: Spatial Indexing at Scale
Rtree wraps libspatialindex so you can build spatial indexes that make proximity lookups, bounding-box filters, and nearest-neighbour searches lightning fast. GeoPandas can use Rtree behind the scenes, but keeping the library in your toolkit means you can accelerate custom data structures or Geoapify API responses before they ever touch a DataFrame.
Why spatial indexes matter
| Scenario | How Rtree helps | Docs |
|---|---|---|
| Nearest POI lookups | Find the closest Geoapify Place without scanning thousands of features. | index.Index.nearest |
| Fast bounding-box filters | Quickly filter features that intersect a viewport or drawn polygon. | index.Index.intersection |
| Large local datasets | Maintain your own cached POI catalogue and query it in milliseconds. | index.Index |
The snippet below pulls cafés near Manhattan’s Union Square via the Geoapify Places API, loads them into an Rtree index, and then finds the five closest cafés to a user-provided location—ideal for realtime search, location-based notifications, or map hover tooltips.
import os
import requests
from rtree import index
from shapely.geometry import shape, Point

API_KEY = os.environ.get("GEOAPIFY_API_KEY")
if not API_KEY:
    raise RuntimeError("Set the GEOAPIFY_API_KEY environment variable")

# 1. Fetch cafés within 1.5 km of Union Square (New York City)
params = {
    "categories": "catering.cafe",
    "filter": "circle:-73.9903,40.7359,1500",
    "limit": 500,
    "apiKey": API_KEY,
}
resp = requests.get("https://api.geoapify.com/v2/places", params=params, timeout=30)
resp.raise_for_status()
features = resp.json()["features"]

# 2. Build an Rtree spatial index
rtree_idx = index.Index()
point_geoms = []
properties = []
for idx_id, feature in enumerate(features):
    geom = shape(feature["geometry"])
    point_geoms.append(geom)
    properties.append(feature.get("properties", {}))
    rtree_idx.insert(idx_id, geom.bounds)

print(f"Loaded {len(point_geoms)} cafés into the index")

# 3. Query the 5 nearest cafés to a user location (14th St–Union Sq Station as example)
user_location = Point(-73.9901, 40.7359)
nearest_ids = list(rtree_idx.nearest(user_location.bounds, 5))

for rank, idx_id in enumerate(nearest_ids, start=1):
    prop = properties[idx_id]
    geom = point_geoms[idx_id]
    distance = user_location.distance(geom) * 111_139  # rough degrees-to-meters factor near NYC
    print(f"#{rank}: {prop.get('name', 'Unnamed cafe')} — ~{distance:.0f} m away")
With Rtree in place you can answer “what’s nearby?” in milliseconds, even as you stitch together Geoapify Places responses, local datasets, or user-generated locations.
Try it now
- Create/activate your virtual environment (
python3 -m venv .venv/py -m venv .venv).- Install dependencies:
pip install rtree shapely requests(on macOS/Linux you may needlibspatialindexvia brew/apt first).- Export
GEOAPIFY_API_KEYand run the script to build the index and print the nearest cafés.- Swap the
filterparameter oruser_locationto power other use cases like delivery zones or partner searches.
6. Folium: Interactive Maps in a Few Lines
Folium wraps the Leaflet.js ecosystem so you can publish interactive maps straight from Python notebooks or scripts. It’s perfect for sharing Geoapify results—geocoded points, isolines, routes, or heatmaps—with stakeholders who prefer a browser-based experience.
Where Folium shines
| Use case | Why it works | Docs |
|---|---|---|
| Quick sharing | Create interactive prototypes in minutes without front-end coding. | folium.Map |
| Layer control | Overlay Geoapify isochrones, Places, and base tiles with toggles. | folium.LayerControl |
| Heatmaps | Visualize POI density or user check-ins. | folium.plugins.HeatMap |
| GeoJSON styling | Render Geoapify polygons/lines with custom colors and tooltips. | folium.GeoJson |
The example below geocodes a shortlist of Brooklyn creative spaces using the Geoapify Geocoding API, requests a 10-minute walking isochrone from the Geoapify Isochrone API, and then renders both on an interactive Folium map with custom styling.
import os
import requests
import folium

API_KEY = os.environ.get("GEOAPIFY_API_KEY")
if not API_KEY:
    raise RuntimeError("Set the GEOAPIFY_API_KEY environment variable")

workspaces = [
    "Brooklyn Navy Yard, NY",
    "Industry City, Brooklyn",
    "New Lab, Brooklyn",
]

# 1. Geocode locations
geocoded = []
for place in workspaces:
    params = {"text": place, "format": "json", "apiKey": API_KEY}
    resp = requests.get("https://api.geoapify.com/v1/geocode/search", params=params, timeout=15)
    resp.raise_for_status()
    result = resp.json()["results"][0]
    geocoded.append({"name": place, "lat": result["lat"], "lon": result["lon"]})

# 2. Request a 20-minute walking isochrone around Brooklyn Navy Yard
iso_params = {
    "lat": geocoded[0]["lat"],
    "lon": geocoded[0]["lon"],
    "type": "time",
    "mode": "walk",
    "range": 1200,
    "apiKey": API_KEY,
}
iso_resp = requests.get("https://api.geoapify.com/v1/isoline", params=iso_params, timeout=30)
iso_geojson = iso_resp.json()

# 3. Build Folium map
center = [geocoded[0]["lat"], geocoded[0]["lon"]]
folium_map = folium.Map(
    location=center,
    zoom_start=13,
    tiles=f"https://maps.geoapify.com/v1/tile/maptiler-3d/{{z}}/{{x}}/{{y}}.png?apiKey={API_KEY}",
    attr="© Geoapify, © OpenMapTiles, © OpenStreetMap contributors"
)

# Add isochrone GeoJSON with styling
folium.GeoJson(
    iso_geojson,
    name="10-min walk",
    style_function=lambda feature: {
        "fillColor": "#1f78b4",
        "color": "#1f78b4",
        "weight": 2,
        "fillOpacity": 0.2,
    },
    tooltip=folium.GeoJsonTooltip(fields=["range"], aliases=["ISO-Time (s)"])
).add_to(folium_map)

# Add markers for each workspace
for place in geocoded:
    # Build a Geoapify marker URL (for example, material icon "work")
    marker_url = (
        f"https://api.geoapify.com/v2/icon/?type=awesome&color=%232ed375&size=50&icon=work&iconType=material&contentSize=15&noShadow&scaleFactor=2&apiKey={API_KEY}"
    )

    folium.Marker(
        [place["lat"], place["lon"]],
        popup=folium.Popup(place["name"], offset=(0, -15)),
        icon=folium.CustomIcon(marker_url, icon_size=(39, 50)),  # choose size
    ).add_to(folium_map)

folium.LayerControl().add_to(folium_map)
folium_map.save("brooklyn-workspaces.html")
print("Map saved to brooklyn-workspaces.html")
Folium makes it easy to share the map file with teammates or embed it in web reports without building a full JavaScript front-end.
Try it now
- Add Folium to your environment:
pip install folium requests.- Export
GEOAPIFY_API_KEYand run the script to generatebrooklyn-workspaces.html.- Open the HTML file in a browser to explore the interactive map, toggle layers, and inspect tooltips.
- Swap the geocoded coordinates or isochrone settings to present your own set of assets.
7. Plotly: Interactive Dashboards and Reports
Plotly brings publication-quality, interactive visualizations to Python. It slots nicely into analytics notebooks, internal dashboards, or web apps—letting you explore Geoapify results with filters, hover cards, and animations without handing everything off to a front-end team.
Why teams reach for Plotly
| Goal | What Plotly delivers | Docs |
|---|---|---|
| Interactive exploration | Pan, zoom, and hover to inspect Geoapify POIs or isolines. | Plotly Express |
| Dashboards | Drop charts into Dash for production-ready analytics. | Dash docs |
| Custom styling | Match brand colors, annotations, and responsive layouts. | Graph objects |
| Map layers | Combine scatter points, polygons, and choropleths over basemaps. | scatter_mapbox |
The example below geocodes art galleries around Manhattan’s Chelsea neighborhood using the Geoapify Places API, requests a 10-minute biking isochrone around the High Line, and then renders everything on an interactive Plotly map with hover tooltips.
import os
import requests
import pandas as pd
import plotly.graph_objects as go
from shapely.geometry import shape

API_KEY = os.environ.get("GEOAPIFY_API_KEY")
if not API_KEY:
    raise RuntimeError("Set the GEOAPIFY_API_KEY environment variable")

# 1. Fetch art galleries within 1 km of the High Line (Chelsea, NYC)
params = {
    "categories": "entertainment.culture.gallery",
    "filter": "circle:-74.0047,40.7480,1000",
    "limit": 200,
    "apiKey": API_KEY,
}
resp = requests.get("https://api.geoapify.com/v2/places", params=params, timeout=30)
resp.raise_for_status()
features = resp.json()["features"]

data = [
    {
        "name": feat["properties"].get("name", "Unnamed gallery"),
        "lat": feat["geometry"]["coordinates"][1],
        "lon": feat["geometry"]["coordinates"][0],
        "rating": feat["properties"].get("rating", "n/a"),
        "address": feat["properties"].get("formatted", "")
    }
    for feat in features
]
galleries = pd.DataFrame(data)

# 2. Request a 10-minute biking isochrone around the same point
iso_params = {
    "lat": 40.7480,
    "lon": -74.0047,
    "type": "time",
    "mode": "bicycle",
    "range": 600,
    "apiKey": API_KEY,
}
isojson = requests.get("https://api.geoapify.com/v1/isoline", params=iso_params, timeout=30).json()

geom = shape(isojson["features"][0]["geometry"])

if isinstance(geom, MultiPolygon):
    geom = max(geom.geoms, key=lambda g: g.area)

x, y = geom.exterior.coords.xy
lat, lon = list(y), list(x)

# 3. Build Plotly figure
fig = go.Figure()

# Isochrone polygon
fig.add_trace(
    go.Scattermap(
        lat=lat,
        lon=lon,
        mode="lines",
        line=dict(color="#1f78b4", width=2),
        fill="toself",
        fillcolor="rgba(31,120,180,0.2)",
        name="10-min bike reach"
    )
)

# Gallery points
fig.add_trace(
    go.Scattermap(
        lat=galleries["lat"],
        lon=galleries["lon"],
        mode="markers",
        marker=dict(size=9, color="#e31a1c"),
        name="Art galleries",
        text=galleries["name"],
        hovertemplate="<b>%{text}</b><br>Rating: %{customdata[0]}<br>%{customdata[1]}<extra></extra>",
        customdata=list(zip(galleries["rating"], galleries["address"]))
    )
)

# Layout (note: use map=, not mapbox=)
fig.update_layout(
    map=dict(
        style="open-street-map",  # can also use Geoapify tiles here
        center=dict(lat=40.7480, lon=-74.0047),
        zoom=14
    ),
    margin=dict(l=0, r=0, t=40, b=0),
    title="Chelsea art galleries within a 10-minute bike ride"
)

fig.write_html("chelsea-galleries.html", auto_open=False)
print("Interactive map saved to chelsea-galleries.html")
Plotly’s HTML export means you can drop the file into Slack, email it to stakeholders, or embed the figure inside Dash without extra tooling.
Try it now
- Install dependencies:
pip install plotly pandas shapely requests.- Set
GEOAPIFY_API_KEY, run the script, and openchelsea-galleries.htmlin your browser.- Hover over markers to inspect gallery names, ratings, and addresses; toggle traces in the legend to focus on specific layers.
- Swap the Places query or isochrone parameters to showcase different assets or travel modes.
8. GeoAlchemy2: Bring PostGIS to Your Python App
GeoAlchemy2 extends SQLAlchemy with spatial types and functions so web apps, APIs, and ETL jobs can talk to PostGIS or other spatial databases using Pythonic ORM patterns. When your Geoapify-powered pipeline needs to persist results or query existing datasets living in PostGIS, GeoAlchemy2 becomes the glue between application logic and the database.
Why GeoAlchemy2 matters
| Requirement | GeoAlchemy2 advantage | Docs |
|---|---|---|
| Store Geoapify results | Persist GeoJSON coordinates or polygons as PostGIS geometry/geography columns. | Spatial types |
| Run spatial queries | Use ST_DWithin, ST_Contains, or custom SQL directly from SQLAlchemy. | Spatial functions |
| ORM integration | Map models with geometry columns while keeping migrations and sessions familiar. | Declarative models |
| Hybrid workflows | Combine Geoapify APIs (geocoding, isolines) with PostGIS analytics in one script. | Examples |
The snippet below geocodes a set of NYC coworking spaces with the Geoapify Geocoding API, stores them in a PostGIS table via GeoAlchemy2, and then queries for all locations within 500 meters of Times Square using ST_DWithin.
import os
import requests
from sqlalchemy import create_engine, Column, Integer, String
from sqlalchemy.orm import declarative_base, sessionmaker
from geoalchemy2 import Geometry
from geoalchemy2.shape import from_shape
from shapely.geometry import Point

API_KEY = os.environ.get("GEOAPIFY_API_KEY")
DATABASE_URL = os.environ.get("DATABASE_URL")  # e.g., postgresql+psycopg://user:pass@localhost:5432/geodb

if not API_KEY:
    raise RuntimeError("Set the GEOAPIFY_API_KEY environment variable")
if not DATABASE_URL:
    raise RuntimeError("Set DATABASE_URL to your PostGIS connection string")

engine = create_engine(DATABASE_URL, echo=False, future=True)
SessionLocal = sessionmaker(bind=engine)
Base = declarative_base()

class Workspace(Base):
    __tablename__ = "workspaces"
    id = Column(Integer, primary_key=True)
    name = Column(String, nullable=False)
    address = Column(String, nullable=False)
    geom = Column(Geometry("POINT", srid=4326), nullable=False)

Base.metadata.create_all(engine)

workspace_names = [
    "WeWork Times Square, New York",
    "Industrious Bryant Park, New York",
    "The Yard: Herald Square, New York",
]

with SessionLocal() as session:
    for name in workspace_names:
        params = {"text": name, "format": "json", "apiKey": API_KEY}
        resp = requests.get("https://api.geoapify.com/v1/geocode/search", params=params, timeout=15)
        resp.raise_for_status()
        result = resp.json()["results"][0]
        point = Point(result["lon"], result["lat"])

        workspace = Workspace(
            name=name,
            address=result.get("formatted", name),
            geom=from_shape(point, srid=4326),
        )
        session.add(workspace)

    session.commit()

with SessionLocal() as session:
    times_square = Point(-73.9855, 40.7580)
    query = (
        session.query(Workspace)
        .filter(Workspace.geom.ST_DWithin(from_shape(times_square, srid=4326), 500))  # meters
    )

    print("Workspaces within 500 m of Times Square:")
    for ws in query:
        print(f"- {ws.name} @ {ws.address}")
This pattern makes it easy to enrich your PostGIS database with Geoapify outputs and run spatial filters directly in SQL—no manual conversions required.
Try it now
- Ensure you have a PostGIS-enabled database and a connection string (
DATABASE_URL).- Install dependencies:
pip install geoalchemy2 sqlalchemy psycopg[binary] shapely requests.- Export
GEOAPIFY_API_KEYandDATABASE_URL, then run the script to populate theworkspacestable and print nearby locations.- Extend the model with additional attributes (e.g., Geoapify opening hours) or wrap the query in a FastAPI/Flask endpoint.
9. PySAL: Spatial Statistics for Deeper Insight
PySAL is the go-to Python library for spatial statistics and econometrics. Whether you’re detecting hotspots, measuring spatial autocorrelation, or modeling clusters, PySAL turns geospatial datasets (including Geoapify outputs) into actionable intelligence that goes beyond simple mapping.
Where PySAL earns its keep
| Task | PySAL capability | Docs |
|---|---|---|
| Spatial autocorrelation | Quantify clustering with Moran’s I or Geary’s C. | esda.moran |
| Hot spot analysis | Run Local Moran’s I or Getis–Ord Gi* to flag hotspots. | esda.moran.Moran_Local |
| Spatial weights | Build k-nearest-neighbor or distance-based weights from coordinate pairs. | libpysal.weights |
| Regression | Model spatial lag/error using spreg. | spreg |
The example below uses the Geoapify Places API to download crime-prevention resources (police stations, community centers) in Chicago, converts the POIs into a grid, and then calculates Local Moran’s I to flag clusters of high or low resource density.
import os
import requests
import geopandas as gpd
import libpysal
from esda import Moran_Local

API_KEY = os.environ.get("GEOAPIFY_API_KEY")
if not API_KEY:
    raise RuntimeError("Set the GEOAPIFY_API_KEY environment variable")

# 1) Fetch POIs (police + community centers) around Chicago (10 km radius)
params = {
    "categories": "service.police,activity.community_center",
    "filter": "circle:-87.6298,41.8781,10000",
    "limit": 500,
    "apiKey": API_KEY,
}
resp = requests.get("https://api.geoapify.com/v2/places", params=params, timeout=30)
resp.raise_for_status()
features = resp.json()["features"]

pois = gpd.GeoDataFrame.from_features(features, crs="EPSG:4326")

# 2) Project to a planar CRS in meters (Illinois East / EPSG:26971)
pois = pois.to_crs(epsg=26971)

# 3) Create a fishnet grid (1 km x 1 km cells) covering the POI extent
cell_size = 1000  # meters
minx, miny, maxx, maxy = pois.total_bounds

# snap bounds to the grid
minx = np.floor(minx / cell_size) * cell_size
miny = np.floor(miny / cell_size) * cell_size
maxx = np.ceil(maxx / cell_size) * cell_size
maxy = np.ceil(maxy / cell_size) * cell_size

xs = np.arange(minx, maxx, cell_size)
ys = np.arange(miny, maxy, cell_size)

cells = [box(x, y, x + cell_size, y + cell_size) for x in xs for y in ys]
fishnet = gpd.GeoDataFrame(geometry=cells, crs=pois.crs)

# 4) Spatial join: count POIs per grid cell
joined = gpd.sjoin(fishnet, pois, how="left", predicate="contains")
counts = joined.groupby(level=0).size()              # group by fishnet index
fishnet["poi_count"] = counts.reindex(fishnet.index, fill_value=0).astype(int)

# 5) Build spatial weights (queen contiguity) and run Local Moran’s I
w = libpysal.weights.Queen.from_dataframe(fishnet)
w.transform = "r"

y = fishnet["poi_count"].values
moran_local = Moran_Local(y, w)

fishnet["local_I"] = moran_local.Is
fishnet["significant"] = moran_local.p_sim < 0.05
fishnet["cluster_type"] = moran_local.q  # 1=HH, 2=LH, 3=LL, 4=HL

print(fishnet[["poi_count", "local_I", "significant", "cluster_type"]].head())
Results include Local Moran’s I statistics, significance flags, and cluster labels (high-high, low-low, etc.), enabling data-driven resource planning.
Try it now
- Install dependencies:
pip install libpysal esda geopandas shapely requests.- Export
GEOAPIFY_API_KEYand run the script to compute Local Moran’s I on Chicago POIs.- Visualize the
fishnetGeoDataFrame withpoi_countorlocal_Iusing GeoPandas.plot()or Folium for hotspots.- Adjust the
categories, grid size, or significance threshold to tailor the analysis.
10. OSMnx: Street Networks on Demand
OSMnx makes it painless to download, analyze, and visualize street networks from OpenStreetMap. For Geoapify users, it’s a natural companion when you need to compare custom network metrics with Geoapify routing, isochrones, or mobility data.
Why OSMnx is a staple
| Use case | OSMnx advantage | Docs |
|---|---|---|
| Fetch street graphs | Download drive, walk, or bike networks with one function call. | graph_from_place |
| Network analytics | Compute betweenness, centrality, and path lengths quickly. | osmnx.algorithms |
| Routing comparisons | Benchmark Geoapify travel times against open-source routing. | shortest_path |
| Visualization | Plot stylized street maps for presentations. | plot_graph |
The example below downloads the pedestrian network around Boston’s Seaport District, requests a 15-minute walking isochrone from the Geoapify Isochrone API, and uses OSMnx to calculate betweenness centrality for edges inside the isochrone boundary.
import os
import requests
import osmnx as ox
import networkx as nx
from shapely.geometry import shape, MultiPolygon

API_KEY = os.getenv("GEOAPIFY_API_KEY")
if not API_KEY:
    raise RuntimeError("Set the GEOAPIFY_API_KEY environment variable")

# 1) Download pedestrian network (use a less ambiguous name)
place = "South Boston, Massachusetts, USA"
G = ox.graph_from_place(place, network_type="walk", simplify=True)

# 2) 15-minute walk isochrone from Geoapify
center_lat, center_lon = 42.3510, -71.0410
iso_params = {"lat": center_lat, "lon": center_lon, "type": "time", "mode": "walk", "range": 900, "apiKey": API_KEY}
isojson = requests.get("https://api.geoapify.com/v1/isoline", params=iso_params, timeout=30).json()

geom = shape(isojson["features"][0]["geometry"]).buffer(0)
if isinstance(geom, MultiPolygon):  # pick the largest piece if multipolygon
    geom = max(geom.geoms, key=lambda g: g.area)

# 3) Clip the network by the isochrone (OSMnx 2.x API)
subgraph = ox.truncate.truncate_graph_polygon(G, geom, truncate_by_edge=True)
subgraph = ox.truncate.largest_component(subgraph)

# 4) Edge betweenness centrality (OSMnx recommends using NetworkX for this)
#    Collapse parallel edges by minimizing 'length', then compute on an undirected view.
D = ox.convert.to_digraph(subgraph, weight="length")
Gu = D.to_undirected()
edge_bc = nx.edge_betweenness_centrality(Gu, weight="length", normalized=True)

# 5) Map results back to the edges GeoDataFrame
edges = ox.convert.graph_to_gdfs(subgraph, nodes=False).reset_index()
edges["pair"] = edges.apply(lambda r: tuple(sorted((r["u"], r["v"]))), axis=1)
edges["betweenness"] = edges["pair"].map(edge_bc).fillna(0.0)

print(edges[["u", "v", "length", "betweenness"]].head())
OSMnx lets you pair Geoapify travel-time outputs with open network metrics, offering richer context for mobility planning and urban analytics.
Try it now
- Install dependencies:
pip install osmnx shapely requests.- Export
GEOAPIFY_API_KEYand run the script to compute betweenness centrality inside the Geoapify isochrone.- Plot
edges_subcolored bybetweenness(e.g.,edges_sub.plot(column="betweenness", cmap="plasma")) to highlight important streets.- Swap the place name or travel mode to analyze other districts or transportation scenarios.
11. xarray + rioxarray: Multidimensional Raster Analytics
xarray treats labeled multidimensional arrays like first-class citizens, while rioxarray adds geospatial awareness (CRS, transforms, reprojection). Together they shine when you’re working with time-series rasters—think climate datasets, hourly heatmaps, or multi-band imagery you want to combine with Geoapify’s vectors.
Why this combo is powerful
| Scenario | xarray + rioxarray edge | Docs |
|---|---|---|
| Time-series rasters | Slice and aggregate by time, level, or other dimensions. | xarray.DataArray |
| On-the-fly reprojection | Keep CRS metadata and reproject via rioxarray. | rioxarray.DataArray.rio.reproject |
| Clip & mask | Use Geoapify polygons to subset large rasters. | rioxarray clip |
| Write cloud-friendly formats | Export to COG/NetCDF/Zarr for scalable storage. | rioxarray export |
The example below retrieves the official Boston city boundary via the Geoapify Place Details API, downloads the necessary SRTM elevation tiles, mosaics them with xarray+rioxarray, and masks the DEM to the city footprint before exporting analysis-ready GeoTIFFs.
import os
import math
import gzip
import requests
from pathlib import Path

import numpy as np
import xarray as xr
import rioxarray as rxr
from shapely.geometry import shape, MultiPolygon, mapping
from rioxarray.merge import merge_arrays
import matplotlib.pyplot as plt

API_KEY = os.getenv("GEOAPIFY_API_KEY")

# --- 1) Get Boston boundary from Geoapify Place Details by OSM id/type ---
# OSM relation 2315704 = City of Boston
params = {
    "osm_id": 2315704,
    "osm_type": "r",
    # Ask for original polygon geometry (adds a feature alongside 'details')
    "features": "details,details.full_geometry",
    "apiKey": API_KEY,
}
resp = requests.get("https://api.geoapify.com/v2/place-details", params=params, timeout=30)
resp.raise_for_status()
fc = resp.json()["features"]

# Prefer the full/original geometry if present, otherwise fallback to details geometry
feat_full = next((f for f in fc if f["properties"].get("feature_type") == "details.full_geometry"), None)
feat_detl = next((f for f in fc if f["properties"].get("feature_type") == "details"), None)
if not (feat_full or feat_detl):
    raise RuntimeError("No boundary geometry returned by Place Details API.")

geom = shape((feat_full or feat_detl)["geometry"])
if isinstance(geom, MultiPolygon):
    geom = max(geom.geoms, key=lambda g: g.area)  # take largest part

# --- 2) Figure out which SRTM tiles we need (1°x1° HGT) and download them ---
def tile_id(sw_lat, sw_lon):
    lat_prefix = "N" if sw_lat >= 0 else "S"
    lon_prefix = "E" if sw_lon >= 0 else "W"
    return f"{lat_prefix}{abs(int(sw_lat)):02d}{lon_prefix}{abs(int(sw_lon)):03d}"

minx, miny, maxx, maxy = geom.bounds  # lon/lat bbox

lat_floors = range(math.floor(miny), math.floor(maxy) + 1)
lon_floors = range(math.floor(minx), math.floor(maxx) + 1)

data_dir = Path("data"); data_dir.mkdir(exist_ok=True)
hgt_paths = []

for lat0 in lat_floors:
    for lon0 in lon_floors:
        tid = tile_id(lat0, lon0)              # e.g., N42W071
        folder = tid[:3]                        # e.g., N42
        url = f"https://s3.amazonaws.com/elevation-tiles-prod/skadi/{folder}/{tid}.hgt.gz"
        gz_path = data_dir / f"{tid}.hgt.gz"
        hgt_path = data_dir / f"{tid}.hgt"

        if not gz_path.exists():
            r = requests.get(url, timeout=60)
            r.raise_for_status()
            gz_path.write_bytes(r.content)
        if not hgt_path.exists():
            with gzip.open(gz_path, "rb") as src, open(hgt_path, "wb") as dst:
                dst.write(src.read())
        hgt_paths.append(hgt_path)

if not hgt_paths:
    raise RuntimeError("No HGT tiles determined from boundary bbox.")

# --- 3) Open tiles as DataArrays, mosaic, and clip to Boston boundary ---
void_vals = (-32768, 32767, -9999, 65535)  # common SRTM/HGT sentinels
arrays = []
for p in hgt_paths:
    da = rxr.open_rasterio(p).squeeze(drop=True).astype("float32")  # -> dims ('y','x'), allow NaNs
    # Ensure CRS + nodata are set
    if da.rio.crs is None:
        da = da.rio.write_crs("EPSG:4326")
    # mask voids and clamp to a plausible elevation range
    da = da.where(~da.isin(void_vals))
    da = da.where((da > -500) & (da < 9000))

    arrays.append(da)

mosaic = merge_arrays(arrays)  # single DataArray in EPSG:4326
mosaic = mosaic.where(~mosaic.isin(void_vals))  # belt & suspenders
clipped = mosaic.rio.clip([mapping(geom)], crs="EPSG:4326")

# Mask NODATA explicitly (common SRTM sentinel)
clipped = clipped.where(clipped != clipped.rio.nodata)

# --- 4) Quick stats and preview ---
stats = dict(
    count=int(np.isfinite(clipped.values).sum()),
    min=float(np.nanmin(clipped.values)),
    mean=float(np.nanmean(clipped.values)),
    max=float(np.nanmax(clipped.values)),
)
print("Boston DEM stats (after masking):", stats)

# --- 5) Save outputs ---
# 5a) Single-band (grayscale) GeoTIFF with proper georeferencing
singleband_path = data_dir / "boston_dem_singleband.tif"
clipped.rio.to_raster(singleband_path, compress="deflate")
print("Wrote single-band DEM:", singleband_path)

# 5b) Colorized RGB GeoTIFF so external apps show the same colors

# Plot (color) in notebook
plt.figure(figsize=(8, 6))
# robust=True trims color limits to 2–98 percentile so extremes don't wash out the color
ax = clipped.plot(cmap="terrain", robust=True)
plt.title("Boston SRTM DEM (colorized)")
plt.tight_layout()
plt.show()

vmin, vmax = np.nanpercentile(clipped.values, [2, 98])
norm = plt.Normalize(vmin=vmin, vmax=vmax)
cmap = plt.get_cmap("terrain")

rgba = cmap(norm(clipped.values))            # H x W x 4
rgb = (rgba[..., :3] * 255).astype("uint8") # 0..255 uint8

rgb_path = data_dir / "boston_dem_rgb.tif"
with rasterio.open(
    rgb_path, "w",
    driver="GTiff",
    height=rgb.shape[0], width=rgb.shape[1],
    count=3, dtype="uint8",
    transform=clipped.rio.transform(),
    crs=clipped.rio.crs,
    compress="deflate"
) as dst:
    dst.write(rgb[..., 0], 1)
    dst.write(rgb[..., 1], 2)
    dst.write(rgb[..., 2], 3)

print("Wrote colorized RGB DEM:", rgb_path)
You now hold both a single-band and colorized DEM clipped to Boston’s boundary—perfect for terrain-aware planning, hazard modeling, or dropping into Geoapify-powered visualizations.
Try it now
- Install dependencies:
pip install xarray rioxarray geopandas shapely requests matplotlib rasterio numpy.- Export
GEOAPIFY_API_KEY(plus any proxy settings if needed) and run the script to download and mosaic the required SRTM tiles automatically.- Review the printed DEM statistics, then open
boston_dem_singleband.tiforboston_dem_rgb.tifin QGIS—or plug them into a Folium/Geoapify visualization.- Swap the boundary ID or change the tile set to clip another city, or extend the notebook to compute slope/relief with xarray operations.
12. GeoPlot + Contextily: Publication-Ready Static Maps
When you need polished static maps for reports or blog posts, GeoPlot and Contextily make a powerful duo. GeoPlot sits atop Matplotlib/Cartopy and plays nicely with GeoPandas, while Contextily drops high-quality basemaps underneath your data with a single call.
Why this pairing works
| Need | GeoPlot + Contextily benefit | Docs |
|---|---|---|
| Quick thematic maps | GeoPlot’s choropleth, pointplot, and polyplot reduce boilerplate. | GeoPlot gallery |
| Basemap integration | Contextily adds Tile-based backgrounds (including Geoapify). | ctx.add_basemap |
| Custom styling | Control colors, classification schemes, and labels with Matplotlib. | GeoPlot docs |
The example below pulls Portland neighborhood polygons from the Geoapify Boundaries API, counts supermarkets returned by the Geoapify Places API inside each boundary, and renders the result as a choropleth with a Geoapify basemap backdrop.
import os
import requests
import geopandas as gpd
import geoplot as gplt
import contextily as ctx
import matplotlib.pyplot as plt

API_KEY = os.environ.get("GEOAPIFY_API_KEY")
if not API_KEY:
    raise RuntimeError("Set the GEOAPIFY_API_KEY environment variable")

# ---- 1) Get Portland neighborhoods via Boundaries "consists-of" ----
# This ID corresponds to Portland; geometry=geometry_1000 returns simplified polygons.
PORTLAND_ID = "51ba64411daca75ec059c0092a6673c54640f00101f901d3d8020000000000c00206920308506f72746c616e64"
bnd_url = (
    "https://api.geoapify.com/v1/boundaries/consists-of"
    f"?id={PORTLAND_ID}&geometry=geometry_1000&apiKey={API_KEY}"
)
bnd_resp = requests.get(bnd_url, timeout=30)
bnd_resp.raise_for_status()
neighborhoods = gpd.GeoDataFrame.from_features(bnd_resp.json()["features"], crs="EPSG:4326")

# ---- 2) Fetch supermarkets inside Portland boundary ----
# Use the same ID with the Places API’s place filter.
places_params = {
    "categories": "commercial.supermarket",
    "filter": f"place:{PORTLAND_ID}",
    "limit": 500,
    "apiKey": API_KEY,
}
p_resp = requests.get("https://api.geoapify.com/v2/places", params=places_params, timeout=30)
p_resp.raise_for_status()
charging_gdf = gpd.GeoDataFrame.from_features(p_resp.json()["features"], crs="EPSG:4326")

# ---- 3) Spatial join: count chargers per neighborhood ----
joined = gpd.sjoin(neighborhoods, charging_gdf, predicate="contains", how="left")
counts = joined.groupby(joined.index).size()
neighborhoods["charger_count"] = neighborhoods.index.map(counts).fillna(0).astype(int)

# ---- 4) Plot a choropleth + points over a Geoapify basemap ----
neighborhoods_3857 = neighborhoods.to_crs(epsg=3857).explode(index_parts=False).reset_index(drop=True)
charging_3857 = charging_gdf.to_crs(epsg=3857)

fig, ax = plt.subplots(figsize=(10, 10))

gplt.choropleth(
    neighborhoods_3857,
    hue="charger_count",
    cmap="Blues",
    linewidth=0.3,
    edgecolor="white",
    legend=True,
    ax=ax,
)
gplt.pointplot(charging_3857, color="#f03b20", alpha=0.7, s=10, ax=ax)

# 1) set a solid extent (pad a bit so at least one tile is guaranteed)
minx, miny, maxx, maxy = neighborhoods_3857.total_bounds
pad = max((maxx - minx), (maxy - miny)) * 0.05  # 5% padding
ax.set_xlim(minx - pad, maxx + pad)
ax.set_ylim(miny - pad, maxy + pad)

# 2) pass source as URL string + correct CRS + explicit zoom
tile_url = f"https://maps.geoapify.com/v1/tile/dark-matter/{{z}}/{{x}}/{{y}}.png?apiKey={API_KEY}"
ctx.add_basemap(
    ax,
    source=tile_url,     # <- string, not dict
    crs="EPSG:3857",
    zoom=12,
    reset_extent=False,
    attribution="© Geoapify, © OpenMapTiles, © OpenStreetMap contributors",
)

ax.set_title("Supermarkets by Portland neighborhood")
ax.axis("off")
plt.tight_layout()
plt.savefig("portland-chargers.png", dpi=200)
print("Static map saved to portland-chargers.png")
Try it now
- Install dependencies:
pip install geoplot contextily geopandas shapely requests matplotlib.- Export
GEOAPIFY_API_KEYand run the script to createportland-chargers.png.- Tweak color ramps, classification bins, or basemap styles to align with your brand guidelines.
- Swap the boundary ID or Places category to highlight different amenities or cities with minimal code changes.
With GeoPlot and Contextily you can turn Geoapify boundaries and POI counts into publication-ready figures for reports, slides, or static assets.
Related Geoapify Guides
Want to explore more Geoapify-powered workflows? Dive into these tutorials and case studies next:


Python Geocoding Tutorial: From Address List to Saved Results


What is OpenStreetMap and Why It Might Be Better than Google Maps


Geospatial Data Analysis: What Is It, Benefits, Examples and Use Cases
FAQ
How do I geocode a list of addresses with Python?
Use Geoapify’s Geocoding API together with GeoPandas. Request addresses via the Geocoding API, convert the JSON results into a GeoDataFrame, and then clean or join them with other datasets.
How can I build a choropleth map in Python?
Follow the workflow in GeoPlot + Contextily. Aggregate your Geoapify Places data by region with GeoPandas, then render the polygons using geoplot.choropleth() and add a Geoapify basemap with Contextily.
How do I calculate travel-time isochrones using Python?
Call the Geoapify Isoline API as shown in the Fiona and Folium sections. Fetch the GeoJSON polygon, load it with Fiona or GeoPandas, and visualize or analyze it in your Python notebook.
What’s the best way to find nearby POIs with Python?
Use Rtree to index Geoapify Places results. Insert each POI geometry into the spatial index, then call nearest() or intersection() to power “what’s nearby” searches without scanning the whole dataset.
How can I process and clean vector data from Geoapify?
GeoPandas is ideal for attribute cleaning, merges, dissolves, and coordinate transformations. Combine it with Fiona for streaming large GeoJSON or GeoPackage files.
How do I store Geoapify results in PostGIS using Python?
Leverage GeoAlchemy2. Convert API responses into Shapely geometries, wrap them with from_shape, and persist them in PostGIS with SQLAlchemy sessions.
How can I detect spatial hotspots or clusters with Python?
See the PySAL example. Build a spatial weights matrix with libpysal and run Moran_Local or Getis–Ord Gi* to flag statistically significant clusters.
How do I fetch and analyze street networks?
Use OSMnx to download walk, bike, or drive graphs, then compute metrics like betweenness centrality. You can clip the network to Geoapify isochrones for mobility studies.
How can I work with raster elevation or climate data in Python?
Follow the Rasterio or xarray + rioxarray workflows. Read tiles with Rasterio, mosaic them, and analyze them as labeled arrays with xarray.
How do I clip rasters to city boundaries using Python?
Combine Geoapify Boundaries with xarray + rioxarray. Download the boundary geometry via the Boundaries API, then call rio.clip() to mask the raster.
What’s the simplest way to publish interactive web maps from Python?
Choose between Folium for quick Leaflet-based maps or Plotly for dashboard-ready figures. Both can consume Geoapify tiles, iso-lines, and Places data.
Can I combine multiple Geoapify APIs in one Python project?
Yes. A typical workflow pulls base tiles from Maps API, regions from Boundaries, travel-time polygons from Isoline, and POI metadata from Place Details—then stitches everything together with the libraries above.
Summary
- Python’s geospatial stack covers the full pipeline: vector cleaning with GeoPandas/Fiona, raster analytics via Rasterio and xarray+rioxarray, and database integration through GeoAlchemy2.
- You can visualize results fast—interactive maps with Folium or Plotly, static presentations with GeoPlot+Contextily, and API data stitched together from Geoapify.
- Advanced analyses like proximity searches (Rtree), network metrics (OSMnx), and hotspot detection (PySAL) plug directly into Geoapify outputs, making production workflows repeatable.