On this page
Map Tiles
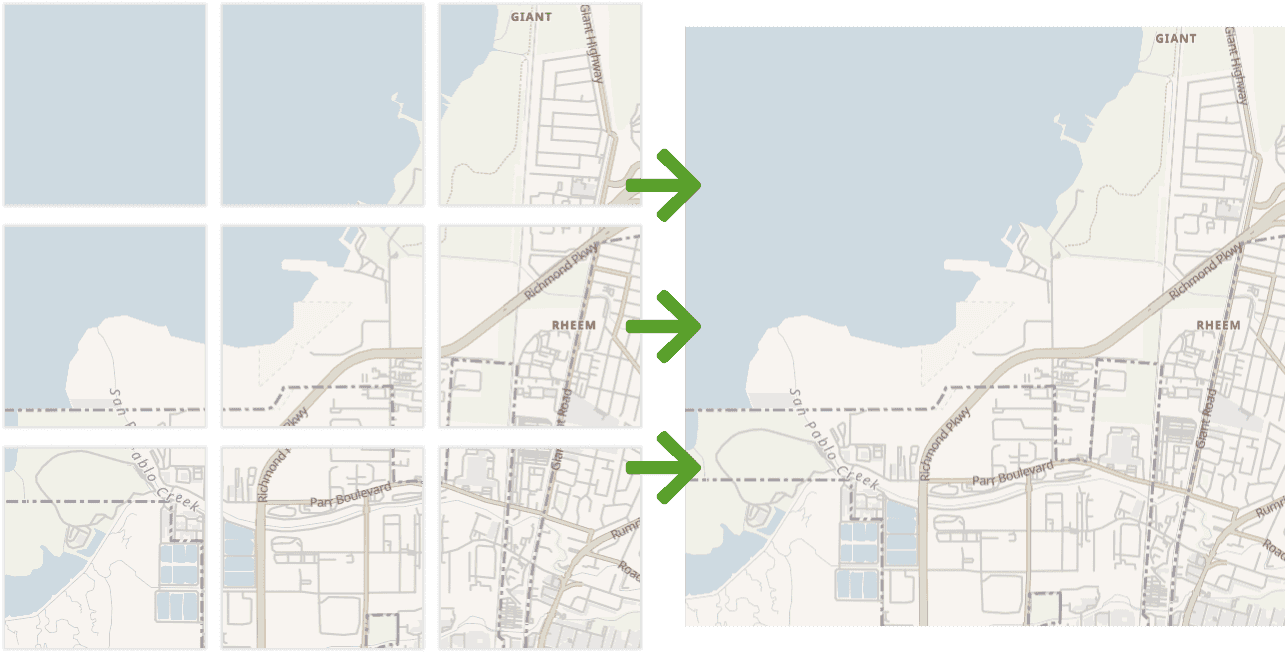
Map tiles are small, square graphical chunks of geographic data, typically rendered as images (raster tiles) or vector-based graphics (vector tiles). These tiles are arranged in a grid and served at multiple zoom levels to compose an entire map view.
They are a fundamental building block used by major mapping libraries, including:
- Leaflet – a lightweight JavaScript library for raster maps
- MapLibre GL – an open-source vector map library and successor to Mapbox GL
- OpenLayers – a feature-rich library designed for advanced GIS and mapping use cases
These libraries dynamically load and stitch together map tiles, enabling users to zoom, pan, and explore maps smoothly and interactively.
By leveraging map tiles, developers can build fast, scalable, and visually rich mapping experiences into web and mobile applications. These mapping tiles can be used for interactive maps, route visualization, and location-based user interfaces across web and mobile projects.
Not sure which map library to use?
Check out our in-depth guide: Leaflet vs MapLibre GL vs OpenLayers – Feature Comparison
Are you eager to start developing your map application? Learn how to obtain an API Key. Then, head to our comprehensive documentation page, where you can explore various map styles and obtain URLs for base-map layers.
Features and Capabilities
We offer map tiles compatible with the standard ZXY format and the famous OpenMapTiles format derived from OpenStreetMap data. With our map tiles, developers can create dynamic and interactive maps using different platforms' most popular map libraries.
OpenStreetMap-based Tiles
OpenStreetMap-based tiles leverage the collective efforts of over six million contributors worldwide, making OpenStreetMap the largest and most comprehensive geodata source available. As a result, these OSM-based tiles offer unparalleled accuracy, up-to-date information, and a wealth of features.
Moreover, thanks to the open nature of the data sources, we can provide you with open tiles. So you can cache, store, and redistribute the generated tiles as needed.

Raster map tiles
Raster tiles are pre-rendered images representing a specific map portion at a specific zoom level. Each tile contains a fixed image of a map area, typically in the form of a PNG or JPEG file. Example Raster Map Tile URLs:
https://maps.geoapify.com/v1/tile/osm-bright-grey/{z}/{x}/{y}.png?apiKey=YOUR_API_KEY

https://maps.geoapify.com/v1/tile/osm-bright-grey/{z}/{x}/{y}@2x.png?apiKey=YOUR_API_KEY
The Raster map URL follows the standard {z}/{x}/{y} pattern, where {z} represents the zoom level, {x} represents the tile's column number, and {y} represents the tile's row number. The .png extension indicates that the raster map tile is in PNG format.
By utilizing these raster map tiles, you can integrate them as a foundational base map layer within popular map libraries such as Leaflet or OpenLayers.

Vector map tiles
Vector tiles, on the other hand, are a more recent advancement in mapping technology. Instead of static images, vector tiles store geospatial data in PBF format as geometric primitives and attributes. This data can include points, lines, polygons, and associated attributes like names, colors, and styles.
Vector tiles allow for dynamic rendering on the client side, enabling greater interactivity and customization. With vector tiles, maps can be dynamically styled, edited, and even animated, providing a more flexible and adaptable mapping experience.
We offer vector map tiles that adhere to the Mapbox Vector Tiles specification, which can be seamlessly integrated with modern map libraries like MapLibre GL.
Vector vs. Raster map tiles
Vector and raster both have their advantages. The best one for you depends on what you're focusing on. On one side, raster tiles are optimized for fast rendering and browsing. On the other side, vector tiles are much more customizable.
To better understand the differences check our article "Raster vs. vector: pros and cons of both map tile types."


Interactive Maps vs. Map Picture
In addition to map tiles for interactive maps, we provide an API that generates map pictures - Static Map API. This makes adding a map view easy for a classic desktop application.
To generate a map image, you only need to specify the map style, and map center, optionally add markers of your choice, and voila!
Getting Started
Getting started with Geoapify's Map Tiles is quick and straightforward. Follow these steps to begin integrating our powerful map tiles into your projects:
1. Sign up and obtain an API key
Start by signing up for an account on the Geoapify platform. Once registered, you can generate an API key granting access to our map tile services and other APIs.
2. Select a map library or map technology
Decide on the map library that best suits your needs. Geoapify's map tiles are compatible with popular libraries like Leaflet, Mapbox/MapLibre GL, and OpenLayers, ensuring seamless integration.
Please note that the choice of map library also determines the map tile type - whether it is vector or raster.
3. Choose a map style
Explore our comprehensive documentation page, where you can find a variety of map styles to choose from. Select the map style that best fits your application or website, considering factors such as color schemes, labeling, and overall aesthetics.
4. Integrate the API
Utilize our API documentation, Playground and code examples to integrate Geoapify's Map Tiles into your application. The documentation provides detailed instructions on API endpoints, parameters, and responses, facilitating a smooth integration process.
Base Map for Leaflet
Adding a base map to Leaflet is a straightforward process. Here's a step-by-step guide on how to do that:
1. Add the Leaflet to your project
- Option 1: Use npm package manager to get a local copy of Leaflet:
npm install leafletIn addition, you can add types for TypeScript projects with:
npm install --save-dev @types/leafletThen you can import the Leaflet objects in the code:
import { control, latLng, map, tileLayer, Browser, ... } from 'leaflet';When installing Leaflet using NPM or another package manager, it's important to note that you need to link the Leaflet CSS file to integrate Leaflet into your project properly.
You can import the CSS file directly into your JavaScript code using an import statement or include it in your HTML file using a link tag. The Leaflet CSS file is typically named leaflet.css or leaflet.min.css.
- Option 2: Add links to Leaflet library in your HTML code:
<link rel="stylesheet" href="https://unpkg.com/[email protected]/dist/leaflet.css" />
<script src="https://unpkg.com/[email protected]/dist/leaflet.js"></script>
Visit Leaflet's Unpkg page to find the freshest links.
2. Create a map with Geoapify's Map Tiles
You need a raster map tile URL to create a map with Leaflet. The process begins by creating a map container and subsequently adding the tile layer to introduce a new layer of tiles onto the map:
Create a Map Container:
HTML
<div id="my-map"></div>CSS
html,
body,
#my-map {
  width: 100%;
  height: 100%;
  margin: 0;
}
Then add the tile layer. You'll need to create a tile layer object and specify the URL template for the raster map tiles. Additionally, you can customize the layer by setting options such as attribution and maximum zoom level, which is 20 for Geoapify's raster map tiles.
// create a map
const map = L.map('my-map').setView([48.1500327, 11.5753989], 10);

// Retina displays require different map tile quality
const isRetina = L.Browser.retina;

const baseUrl = "https://maps.geoapify.com/v1/tile/osm-bright/{z}/{x}/{y}.png?apiKey={apiKey}";
const retinaUrl = "https://maps.geoapify.com/v1/tile/osm-bright/{z}/{x}/{y}@2x.png?apiKey={apiKey}";

// Add map tiles layer. Set 20 as the maximal zoom and provide map data attribution.
L.tileLayer(isRetina ? retinaUrl : baseUrl, {
    attribution: 'Powered by <a href="https://www.geoapify.com/" target="_blank">Geoapify</a> | <a href="https://openmaptiles.org/" target="_blank">© OpenMapTiles</a> <a href="https://www.openstreetmap.org/copyright" target="_blank">© OpenStreetMap</a>',
    apiKey: 'YOUR_API_KEY',
    maxZoom: 20,
    id: 'osm-bright',
}).addTo(map);
Retina displays require higher-quality map tiles to ensure sharp and crisp rendering. In the provided code snippet, a Retina display is detected using the L.Browser.retina property. If a Retina display is detected, the map layer uses the @2x URL pointing to the high-resolution map tiles.
For detailed information about the functionality and features of Leaflet, we recommend referring to the official Leaflet's documentation.
Leaflet does not support vector tiles natively. If you need Leaflet vector tiles, you can use a MapLibre bridge plugin for Leaflet (maplibre-gl-leaflet). See a complete code sample here: Leaflet Vector Map Tiles (Geoapify + MapLibre plugin).
Base Map for MapLibre GL (Mapbox GL)
MapLibre GL is an open-source and community-supported fork of Mapbox GL, released under the permissive BSD-3-Clause license, making it suitable for use in both commercial projects and businesses.
With MapLibre GL, you can harness the power of vector map tiles and unlock a wide range of customization options for your mapping projects:
- You have the flexibility to modify map styles by adjusting colors, fonts, and other visual elements to align with your project's branding or design requirements.
- Additionally, MapLibre GL enables you to localize maps for different regions or languages, ensuring a tailored and personalized experience for your users.
- You can also add or hide specific information on the map, tailoring it to display only the relevant data for your specific use case. Embrace the capabilities of MapLibre GL to create highly customizable and visually stunning maps that meet the unique needs of your project.
1. Add the MapLibre GL to your project
Just like Leaflet, there are multiple ways to add MapLibre GL to your project. Here are two commonly used approaches:
- Option 1. Install MapLibre GL as a dependency using NPM or Yarn:
npm i maplibre-glThe MapLibre GL library package is equipped with types, eliminating the need for a separate installation when working with TypeScript projects. This ensures that TypeScript developers can seamlessly leverage the benefits of strong typing and enhanced code editor support right out of the box.
You can import MapLibre GL's definitions in your files this way:
import { LngLatBounds, Map, Marker, Popup } from 'maplibre-gl';It's important to note that when incorporating MapLibre GL into your project, you should also remember to link the corresponding CSS file. This is crucial for ensuring that the necessary styles and visual components of MapLibre GL are properly applied and displayed.
- Option 2. You can include MapLibre GL by adding a script tag in your HTML file. This method allows you to directly reference the MapLibre GL library from a remote CDN or a local file:
<script type="text/javascript" src="https://unpkg.com/[email protected]/dist/maplibre-gl.js"></script>
<link rel="stylesheet" type="text/css" href="https://unpkg.com/[email protected]/dist/maplibre-gl.css">
2. Create a map with Geoapify's Map Layer
You must use the Map style link to create a base map layer in MapLibre GL. This style link contains a comprehensive definition of the map's visual appearance, including important details such as attribution requirements, zoom settings, and other map options.
Before integrating a map using MapLibre GL, you'll first need to create an HTML container element to hold the map:
HTML
<div id="map"></div>CSS
#map { position: absolute; top: 0; bottom: 0; width: 100%; }After creating the HTML container, you can proceed with other steps, such as setting up the map configuration and adding interactive elements to enhance the map functionality:
JavaScript
const map = new maplibregl.Map({
  container: 'map',
  style: `https://maps.geoapify.com/v1/styles/klokantech-basic/style.json?apiKey=YOUR_API_KEY`,
});

map.addControl(new maplibregl.NavigationControl());
The code initializes a MapLibre GL map instance, assigns it to the 'my-map' container, sets the map style using a JSON file URL, and adds a navigation control for enhanced map interactivity.
More Map Tile tutorials
Explore the following tutorials to gain valuable insights and guidance on creating custom maps tailored to your specific needs. These tutorials provide step-by-step instructions, tips, and examples to assist you in harnessing the full potential of custom map creation:


Localizing Maps: Language Switching Made Easy in JSFiddle


Customize a Map Style: adding cycleways layer


Adding OpenStreetMaps-based Maps to ReactJS app


How to use Map Libraries in Angular


Map Localization With Maputnik - Change Language For Cities, Roads, and Other Labels on a Map
Still not sure how to start? If you're facing any problems or have questions, we're here to help! Contact us and we will be happy to assist.
Pricing
Credits are a unit of measurement used by Geoapify to quantify the usage of our services. They serve as a universal currency for calculating the cost of API calls and other related activities. In our pricing model, 1 map tile request is equivalent to 0.25 credits.
To provide you with a clearer understanding, here are a few examples:
- Requesting 500 map tiles will consume 125 credits.
- Retrieving 1000 map tiles will consume 250 credits.
- Generating 200 map tiles will consume 50 credits.
At Geoapify, we offer a variety of Pricing Plans tailored to different levels of usage and requirements. If you're just starting out or want to try our services at no cost, we have a Free plan available that provides 3000 credits per day. This allows you to explore our offerings and determine the best fit for your mapping applications. If you're looking for free map tiles to get started, the Free plan is usually enough for prototyping and smaller projects.
Please note that the number of map tiles required may vary depending on your specific map and zoom levels. To accurately assess your usage and estimate costs, we recommend integrating the maps into your application and monitoring usage statistics for 1-2 weeks. This will help you determine your consumption and make necessary plan adjustments.
We provide a convenient Price Calculator to help you estimate pricing based on your expected usage. This tool considers factors like the number of user sessions, map tile quantities, and other relevant parameters. It serves as a valuable resource for forecasting and budgeting your mapping needs.
Our team is also available to offer personalized assistance and guidance in selecting the most suitable plan for your specific requirements.
FAQ
What are map tiles?
A map is organized in a number of smaller portions known as map tiles. These map tiles are transferred one by one to your device and combined there to form a complete and ready-to-use map. A map tile URL contains the information a map library needs to determine where to get required map tiles from. Check map tile URLs provided by Geoapify here >>
What is the difference between raster and vector map tiles?
Raster map tiles are pre-rendered images, while vector map tiles contain raw geographic data that is rendered dynamically on the user's device. Raster tiles are optimized for fast rendering and browsing, while vector tiles offer greater flexibility and customization options.
Why are vector tiles better than raster?
Vector tiles are more modern than raster tiles and offer greater flexibility than raster tiles. For example, you can customize the styles of the map or localize the map to support multiple languages.
How are map tiles used in interactive maps?
Map libraries like Leaflet, Mapbox/MapLibre GL, and OpenLayers utilize map tiles to create interactive maps. These libraries seamlessly assemble map tiles together, enabling users to zoom in and out, pan, and explore different areas with smooth transitions.
How can I modify map styles and create my map style?
Geoapify Map styles follow the Mapbox GL style specification. Therefore, you can create your own map style from scratch or derive it from existing styles. Here is a tutorial on how to style a map >>
Do I need to provide attribution to visualize OpenStreetMap tiles?
Yes, OpenStreetMap attribution is required for all OSM-based map tiles. In addition, some map styles require attribution to OpenMapTiles. You also need to add Geoapify attribution for all Free plans. We add the attribution automatically when you create a map with a style.json link.
Are Geoapify maps compatible with my technology stack?
Our Map Tiles API follows the most widely supported ZXY tile format with 256x256 sized tiles. It works well with almost any software, library, SDK, or technology that supports tiled map sources. Older SDKs and GIS software like QGIS generally support only raster maps. For new applications, we recommend using Mapbox GL for Web and GL Native for Mobile development.
Can Geoapify maps work without an Internet connection?
Yes, this is possible. Geoapify Maps and Geoapify Location Platform in general can be configured and installed on-premise. Please contact the Geoapify team for details.
How often are map tiles updated?
The Geoapify team updates maps and underlying datasets once per month. Contact us if you need more frequent updates.
Can I generate map tiles with Geoapify?
Yes. You can use Geoapify tile endpoints as a map tiles generator by selecting a map style and requesting tiles by URL pattern {z}/{x}/{y}. You can generate, store, reuse, and resell tile-based products, but make sure you respect RPS limits to avoid temporary blocking and always provide proper attribution (Geoapify/OpenStreetMap/OpenMapTiles as required by the selected style and plan).
Can I cache or redistribute map tiles?
Yes, with Geoapify's open tile policy, you can cache, store, and redistribute the generated map tiles. This allows for more efficient loading and better performance in your applications.
Which map library should I choose for my project?
It depends on your project’s goals. Leaflet is great for lightweight apps, MapLibre GL supports modern vector maps with styling, and OpenLayers offers advanced GIS capabilities. We’ve created a detailed comparison to help you decide — read it here: Map Libraries Comparison.


