


Customization plays a significant role in map creation. Having the ability to adjust map colors, text font, or change language can be quite helpful when creating a map that matches your specific needs.
Vector maps are highly customizable that let you control every aspect of the resulting maps. And, in this tutorial, we will explain the vector maps and show you how to style OSM-based maps to make them fit your website design.
Customizing Vector Maps
Unlike raster maps, vector map tiles consist of data, not pictures. So a map library deals with pieces of data or tiles that should be rendered according to the provided styling rules or map style.
In other words, to create a vector map, you need:
- map data that is provided as map tiles;
- map style that describes which data to show on the map and how to render it.
The map tiles are generated by a tile server, and the map style is specified in the project when you create a map with a map library. So, this means you can't change the map data, but you can decide which data to visualize and how to do that.
A style.json connects those two parts. It contains tile server links and describes map layers. Therefore all you need to create a map is to pass a style.json to your map library as an input parameter.
The link to the style.json file can be external that correspond to a ready-to-use map style, or it could be a link to a custom style.json file. In other words, you can create a custom style.json for your project, for example, by choosing one of the Map Styles as a base.
Here is a video explaining how to create a custom style.json with the Maputnik map style editor:
Let's go further into details to see what map tiles are and learn more about style.json structure.
Map tiles and data available
The information available in every map tile depends on the type of tile schema used by the map provider. For example, Geoapify Map Tiles are based on OpenMapTiles vector tiles schema.
The schema groups the OpenStreetMap objects by their nature:
- aerodrome_label
- aeroway
- boundary
- building
- housenumber
- landcover
- landuse
- mountain_peak
- park
- place
- poi
- transportation
- transportation_name
- water
- water_name
- waterway
All the objects can be easily queried by their properties, classes and subclasses. So by browsing the schema, you can find out which objects and properties you can add to your map. Note: on small zoom levels, some objects might be skipped to avoid overloading the map.
Map Style structure
The map style determines which details are added to the map and how to render these details. It has the Mapbox style specification. Here is an example of data you can find in Geoapify OSM Bright Grey style.json:
- 8
- "osm-bright-grey"
- {} 4 keys▶
- {} 1 key▶
- "https://maps.geoapify.com/v1/styles/osm-bright-grey/sprite?apiKey=7b4rt2u79b810e28ddb141889f9ea58dbw"
- "https://maps.geoapify.com/v1/styles/osm-bright-grey/fonts/{fontstack}/{range}.pbf?apiKey=7b4rt2u79b810e28ddb141889f9ea58dbw"
- [] 112 items▶
- "kusglxf9i"
By analyzing the JSON file, you can quickly identify links to Geoapify tiles servers and resources, and find descriptions for layers visualization. This style describes how to visualize 112 layers, where each layer has one of "fill", "line", "symbol", "circle", "heatmap", "fill-extrusion", "raster", "hillshade", "background", "sky" type. The "source-layer" and "filter" property describes the data to be visualized by each layer. For example, this part describes how to visualize paths:
{
  "id": "highway-path",
  "type": "line",
  "metadata": {
    "mapbox:group": "1444849345966.4436"
  },
  "source": "default",
  "source-layer": "transportation",
  "filter": [
    "all",
    [ "==", "$type", "LineString" ],
    [ "all", [ "!in", "brunnel", "bridge", "tunnel" ], ["==", "class", "path" ]]
  ],
  "paint": {
    "line-color": "#cba",
    "line-dasharray": [ 1.5, 0.75 ],
    "line-width": {
      "base": 1.2,
      "stops": [ [ 15, 1.2 ], [ 20, 4 ] ]
    }
  }
}
Here you see that we query data of type LineString having property "brunnel" not in ["bridge", "tunnel"] and property "class" equal to "path" from the "transportation".
Add a new cycleways layer to the map
Let's add a new layer to the map. For example, let's draw cycleways or bike routes.
Step 1. Get a base map for customization
We will use the OSM Bright map style as a base for our custom map style. You'll need to register and obtain an API key in order to use the Geoapify Maps:
https://maps.geoapify.com/v1/styles/osm-bright-smooth/style.json?apiKey=YOUR_API_KEYWe recommend that you use the visual style editor Maputnik to modify the style.json. However, you can make all changes in any text editor.
Here is how you can add the base map URL to the Maputnik:
- Press the "Open" button from the top menu
- Add Map Tile style.json URL to the "Load from URL" field:
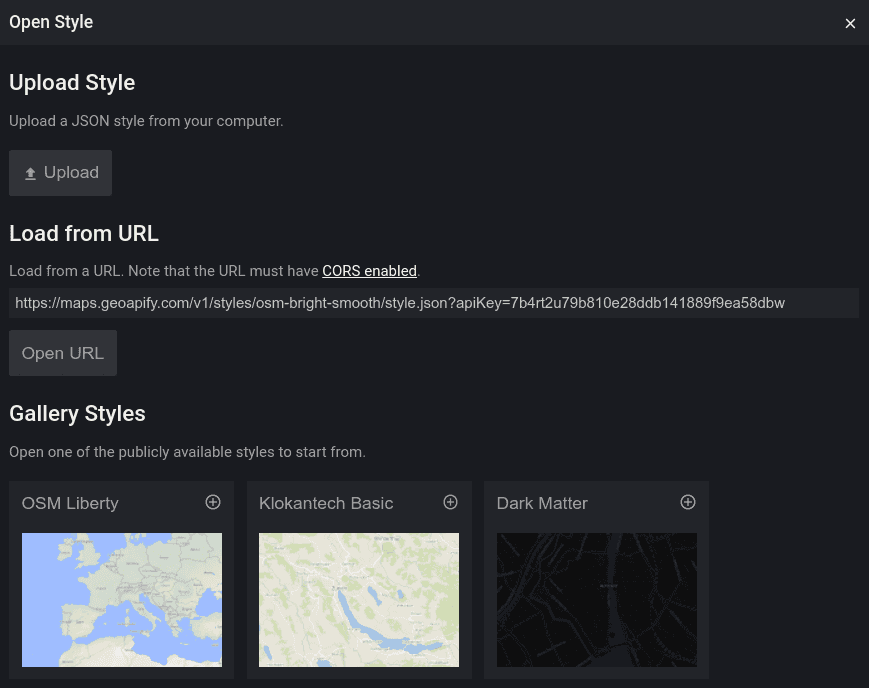
- Now you can edit the map style in the visual editor. Just press Export and then Download to get a copy of the style.json file when you finish customizing.
Step 2. Find out which layers and properties to use
By analyzing tile schema, we see that the cycleway data we are interested in belongs to the "transportation" layer and its "bicycle" and "subclass"="cycleway" properties.
According to the documentation, the "bicycle" field corresponds to the "bicycle" OSM tag, and the "subclass"="cycleway" corresponds to the "highway=cycleway" tag value.
The following "bicycle" tag values can tell that bikers are allowed to use the road:
- "yes"
- "designated"
- "permissive"
- "official"
- "lane"
Note: OSM is an open-source project that constantly evolves, and Map Style data support not all existing tags. For example, the tag "cycleway" can be used only in custom Map Tiles versions now on request.
Step 3. Describe the new cycleways layer in terms of Style Specification
Now we simply need to create a new map layer that queries the data of the needed type and with the required properties.
In Maputnik, you can add a new player by cloning one of the existing layers or creating a new layer (with the "Add layer" button). We recommend you clone the "highway-path" layer, for example. Then you can edit properties in the dedicated fields or the JSON object in JSON Editor.
We want to show the cycleways as lines on the map, adding them as a Line Layer. The "sourcelayer" and "filter" properties determine what data will be visualized on the layer, and the "paint" and "layout" properties define how the data will be shown on the map.
Looking at the schema, the source layer for transportation information is "transportation":
{
  "id": "highway-cycleways",
  "type": "line",
  "source": "default",
  "source-layer": "transportation",
  "filter": [...],
  "paint": {...},
  "layout": {...},
}
Now let's define a filter using properties and fields we've discovered in the previous step:
- "subclass"="cycleway"
- "bicycle" in ["yes", "designated", "permissive", "official", "lane"]
Moreover, similar to other road layers, we can specify the data type - LineString.
Using the "Expressions" syntax, you can determine data type and conditions in the filter property to specify layer data:
{
    ...
    "filter": [
    "all",
    ["==", "$type", "LineString"],
    [
      "any",
      [
        "in",
        "bicycle",
        "yes",
        "designated",
        "permissive",
        "official",
        "lane"
      ],
      ["==", "subclass", "cycleway"]
    ]
  ]
}
Which corresponds to the following condition:
(TYPE = "LineString") AND (("bicycle" in ["yes", "designated", "permissive", "official", "lane"]) OR ("subclass" = "cycleway"))The Paint and Layout properties let you define the appearance of cycleways: line color, line width, line style, etc. Here are two examples of the cycleway line style:
- Solid line:
{
  ...
  "paint": {
    "line-color": "rgba(215, 41, 196, 1)",
    "line-width": 5
  },
  "layout": {
    "line-cap": "round",
    "line-join": "round",
    "visibility": "visible"
  },
}- Dashed line:
{
  "paint": {
    "line-dasharray": [1.5, 0.75],
    "line-width": {
      "base": 1.2,
      "stops": [[15, 1.2], [20, 4]]
    },
    "line-color": "rgba(215, 41, 196, 1)"
  }
}Note: the line width from the second example using interpolate expression that depends on map zoom level.
Here is an example of JSON Object describing the cycleways layer:
{
  "id": "highway-cycleway",
  "type": "line",
  "metadata": {
    "mapbox:group": "1444849345966.4436"
  },
  "source": "default",
  "source-layer": "transportation",
  "filter": [
    "all",
    ["==", "$type", "LineString"],
    [
      "any",
      [
        "in",
        "bicycle",
        "yes",
        "designated",
        "permissive",
        "official"
      ],
      ["==", "subclass", "cycleway"]
    ]
  ],
  "paint": {
    "line-color": "rgba(215, 41, 196, 1)",
    "line-width": 5
  },
  "layout": {
    "line-cap": "round",
    "line-join": "round",
    "visibility": "visible"
  },
  "minzoom": 14
}
Step 4. Use the custom style.json in your project
When you've customized style.json, you can use it in your map application by providing the path to the file when you create a map object.
What's next
- Learn more about Geoapify Map Tiles >>
- Learn how to localize a map with Maputnik >>
- Learn how to change map colors with Maputnik >>
- Check out our Raster Vs Map Tiles article