


Styling a map means editing its style.json: the JSON file that tells a vector map renderer which data to draw and which colors, fonts and line widths to use. There are two ways to customize it:
- Edit a copy of the style in the Maputnik visual editor and load the exported file in your app.
- Change layers at runtime with MapLibre GL JS methods such as
setPaintProperty(), keeping the original style URL.
Either way, start from one of Geoapify's 18 OpenStreetMap styles instead of building a style from scratch. You can also watch the Maputnik part of this tutorial in the video below:
On this page
How does a map style work?
A map style is a JSON document, defined by the MapLibre Style Spec, that describes what to draw on a vector map and how to draw it. The map library downloads the style, then fetches tiles, fonts and icons from the URLs listed in it. That's why one line, style: "https://maps.geoapify.com/v1/styles/osm-bright/style.json?apiKey=YOUR_API_KEY", is enough to show a complete map.
A style has a few top-level parts:
| Key | What it holds | In Geoapify's osm-bright style |
|---|---|---|
sources | Where the map data comes from | One vector source, default, pointing to Geoapify vector tiles built with the OpenMapTiles schema |
layers | What to draw, in order from bottom to top | 111 layers: background, landuse, water, roads, buildings, labels |
glyphs | Font files for labels | A Geoapify fonts URL |
sprite | Icons used by POI and road-shield layers | A Geoapify sprite URL |
Each layer reads one source-layer from the tiles (for example water, building or water_name), can narrow it down with a filter, and sets two groups of properties. Paint properties control how features look: fill-color, line-width, text-color, text-halo-color. Layout properties control placement and content: visibility, text-field, text-font, text-size.
Here is a short excerpt from the real osm-bright style. It shows the source, the fonts and icons URLs, and two layers: the water fill and the ocean labels.
{
  "version": 8,
  "name": "osm-bright",
  "sources": {
    "default": {
      "type": "vector",
      "url": "https://maps.geoapify.com/v1/styles/osm-bright/data.json?apiKey=YOUR_API_KEY"
    }
  },
  "sprite": "https://maps.geoapify.com/v1/styles/osm-bright/sprite?apiKey=YOUR_API_KEY",
  "glyphs": "https://maps.geoapify.com/v1/styles/osm-bright/fonts/{fontstack}/{range}.pbf?apiKey=YOUR_API_KEY",
  "layers": [
    {
      "id": "water",
      "type": "fill",
      "source": "default",
      "source-layer": "water",
      "layout": { "visibility": "visible" },
      "paint": { "fill-color": "hsl(210, 67%, 85%)" }
    },
    {
      "id": "water-name-ocean",
      "type": "symbol",
      "source": "default",
      "source-layer": "water_name",
      "filter": ["all", ["==", "$type", "Point"], ["==", "class", "ocean"]],
      "layout": {
        "text-font": ["Noto Sans Italic"],
        "text-size": 14,
        "text-field": "{name:latin}"
      },
      "paint": {
        "text-color": "#74aee9",
        "text-halo-width": 1.5,
        "text-halo-color": "rgba(255,255,255,0.7)"
      }
    }
  ]
}To make the water darker, you change one value: fill-color of the water layer. To change the ocean labels, you edit text-color, text-size or text-font of water-name-ocean. The text-field value decides which name is shown; changing it is how you localize map labels.
Which base style should you choose?
Pick the base style that already shows the data you need and is closest to your target look. Restyling Positron for a light, low-contrast background takes a few color changes; turning OSM Bright into a dark map means editing most of its layers. Geoapify offers 18 OpenStreetMap styles, listed with previews on the Map Tiles documentation page:
| Style family | Style IDs | Layers in the first style | Note |
|---|---|---|---|
| OSM Bright | osm-bright, osm-bright-grey, osm-bright-smooth | 111 | Detailed general-purpose map |
| OSM Carto | osm-carto | 1 (raster) | Raster only: nothing to restyle |
| OSM Liberty | osm-liberty | 101 | Includes 3D building extrusions |
| Klokantech Basic | klokantech-basic | 47 | Basic general-purpose map |
| MapTiler 3D | maptiler-3d | 39 | Includes 3D building extrusions |
| Positron | positron, positron-blue, positron-red | 47 | Light background for data overlays |
| Dark Matter | dark-matter, dark-matter-brown, dark-matter-dark-grey, dark-matter-dark-purple, dark-matter-purple-roads, dark-matter-yellow-roads | 42 | Dark background |
| Toner | toner, toner-grey | 37 | Black-and-white or grey |
All styles except osm-carto are available as vector styles, so you can customize them. Every style uses the same URL pattern:
https://maps.geoapify.com/v1/styles/<style>/style.json?apiKey=YOUR_API_KEYThe number of layers (counted in each family's first style on 14 October 2026) is a useful hint for how much work a restyle takes: recoloring 37 Toner layers is quicker than going through 111 in OSM Bright. To compare styles side by side before you edit one, switch between them in the Map Tiles Playground.
How do you customize a style in Maputnik?
Maputnik is a free, open-source visual editor for MapLibre styles, now maintained by the MapLibre community. It can open any Geoapify vector style and lets you change colors, fonts and labels while you see the result on the map.
You can design your maps in the online editor (styles are kept in your browser's local storage) or run the Maputnik CLI locally. The Maputnik Wiki describes all of its features. Open the online editor to follow the steps below:
Step 1. Open a map style from a link
Click the "Open" menu and paste the URL of the style you will use as a base:

- Choose a map style on Geoapify API Docs or from the table above.
- Get an API key on Geoapify MyProjects and put it into the style URL.
Note that you can also start from one of Maputnik's Gallery Styles, but they load data from a different map data provider. Check that provider's conditions and pricing before you start designing your map.
Geoapify's Free plan includes 3,000 credits per day, and one map tile costs 0.25 credits, so you get 12,000 map tiles per day for free. Check the Geoapify Pricing page for paid plans.
Step 2. Customize your map
Select a layer in the Maputnik layer list, or click the corresponding area on the map, to edit its paint and layout properties:
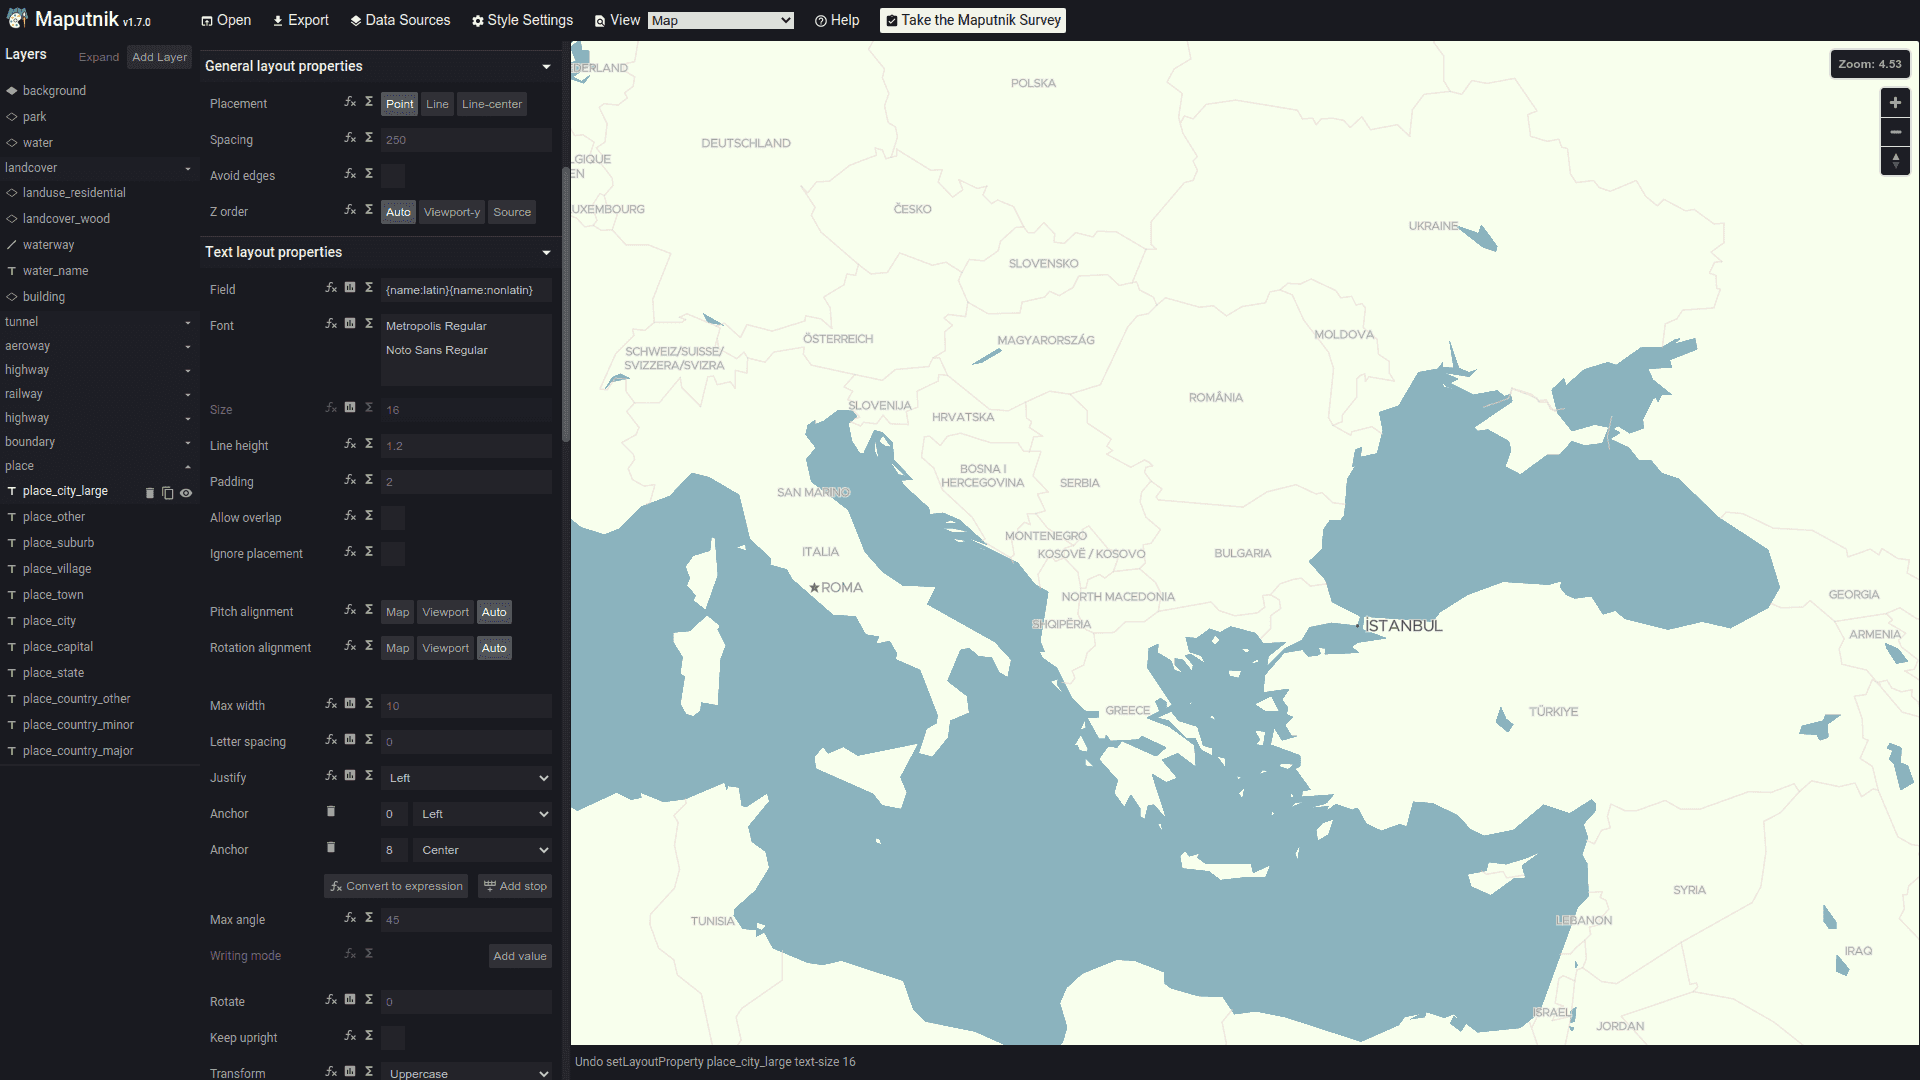
- Colors: change fill, line and text colors, for example
fill-colorofwaterorbackground. - Labels: change
text-font,text-size,text-colorand halo settings of symbol layers, or hide label layers you don't need. - Zoom levels: browse the map at different zoom levels to see how it looks. Properties can take different values per zoom; in
osm-bright, thebuildingfill changes from#f2eae2to#dfdbd7between zoom 15.5 and 16. - New layers: you can add layers based on the OpenMapTiles schema that Geoapify vector tiles use. Our tutorial Customize a map style: add new layers walks through it.
Step 3. Download and use the generated map style
When the map looks right, export the style and add it to your project:
- Click the "Export" menu button and download the generated style JSON file.
- Add the file to your project, for example as
my-style.json. - Set it as the map style in your map library, as shown in the next section.
The exported file keeps the Geoapify tile, font and sprite URLs, including your API key, so you don't need to configure any other access tokens.
How do you load your custom style in MapLibre GL JS?
You load an exported style the same way as a hosted one: pass its URL to the style option of MapLibre GL JS. A relative path to the file in your project works. MapLibre GL JS 6 is distributed as an ES module, so the example imports it with <script type="module">.
Here is a minimal project with two files: index.html and my-style.json (your exported style).
index.html
<!DOCTYPE html>
<html>
  <head>
    <meta charset="utf-8" />
    <title>Custom map style</title>
    <link
      href="https://unpkg.com/[email protected]/dist/maplibre-gl.css"
      rel="stylesheet"
    />
    <style>
      body {
        margin: 0;
        padding: 0;
      }

      #my-map {
        position: absolute;
        top: 0;
        bottom: 0;
        width: 100%;
      }
    </style>
  </head>

  <body>
    <div id="my-map"></div>

    <script type="module">
      import * as maplibregl from "https://unpkg.com/[email protected]/dist/maplibre-gl.mjs";

      const map = new maplibregl.Map({
        container: "my-map",
        style: "./my-style.json",
      });

      map.addControl(new maplibregl.NavigationControl());
    </script>
  </body>
</html>
Serve the folder over HTTP (for example, with npx serve .) instead of opening the file directly: browsers block loading my-style.json from a file:// page. If you bundle your app, install the library with npm install maplibre-gl and import it the same way.
Because the style file contains your API key, anyone who opens the page can see it. In MyProjects, protect the key by listing allowed IP addresses, HTTP referrers, origins and CORS settings, so it only works on your sites.
How do you change map colors without an editor?
For a few changes, you don't need to export a style at all. Load the original Geoapify style URL and change layer properties in code once the style has loaded: setPaintProperty() for colors and setLayoutProperty() for visibility, fonts and text. This keeps you on the hosted style, so you don't have to maintain a copy.
const map = new maplibregl.Map({
  container: "my-map",
  style: "https://maps.geoapify.com/v1/styles/osm-bright/style.json?apiKey=YOUR_API_KEY",
});

map.on("load", () => {
  // Change the water color
  if (map.getLayer("water")) {
    map.setPaintProperty("water", "fill-color", "#9bd7f5");
  }

  // Make buildings less prominent
  if (map.getLayer("building")) {
    map.setPaintProperty("building", "fill-color", "#e6e8eb");
  }

  // Recolor ocean labels
  if (map.getLayer("water-name-ocean")) {
    map.setPaintProperty("water-name-ocean", "text-color", "#1d4e89");
  }

  // Hide POI labels when your app shows its own places
  for (const id of ["poi-level-1", "poi-level-2", "poi-level-3"]) {
    if (map.getLayer(id)) {
      map.setLayoutProperty(id, "visibility", "none");
    }
  }
});
Layer IDs differ between styles. In osm-bright, POI labels are split into poi-level-1, poi-level-2 and poi-level-3, while klokantech-basic uses a single poi_label layer. Run map.getStyle().layers.map((layer) => layer.id) in the browser console to list the IDs of your style, and keep the getLayer() checks so that switching the base style doesn't throw errors on missing layers. The Geoapify guide How to change the style of a map covers this approach and switching between styles.
What's next
These resources help you go further with custom map styles and Geoapify maps:
- Customize a map style: add new layers: add your own layers in Maputnik.
- Map localization with Maputnik: show labels in a specific language.
- Code samples and templates to start a map project quickly.
- Vector vs raster map tiles: why only vector styles can be restyled in the browser.
- Seasonal map styles: switch the same style to Christmas, Easter or Halloween colors by date.
- Adding markers? The Marker Icon API generates custom map marker icons.
- Need map images instead of an interactive map? See Geoapify Static Maps.
FAQ
How do I change the colors of an OpenStreetMap map?
Use a vector style and change the paint properties of its layers, for example fill-color of the water layer. You can do it visually in Maputnik and export a new style.json, or in code with MapLibre GL JS setPaintProperty() after the map loads. See How to change the style of a map.
Can I host my own style.json?
Yes. Export the style from Maputnik, add it to your project and pass its URL to the map library. The tiles, fonts and icons still come from Geoapify, using the API key stored in the file, so restrict the key to your domains.
Which map styles does Geoapify offer?
Geoapify offers 18 OpenStreetMap styles, including OSM Bright, OSM Liberty, Klokantech Basic, MapTiler 3D, Positron, Dark Matter and Toner variants. All except the raster osm-carto style are available as vector styles. See the Map Tiles documentation for previews and URLs.
Is Maputnik free?
Yes. Maputnik is an open-source (MIT-licensed) editor for MapLibre styles, maintained under the MapLibre organization. Use the online editor or run it locally with the Maputnik CLI.
Do I need Mapbox GL JS to use a custom style?
No. Geoapify styles work with MapLibre GL JS, the open-source library used in this article. OpenLayers can render them with the ol-mapbox-style plugin. See the MapLibre GL and OpenLayers code samples.


