Category: Solutions | Page 3
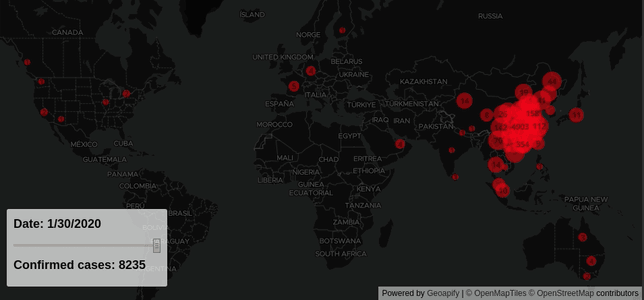
Learn how to visualize series data on a map with Mapbox GL map library. We used Covid-19 statistical data to...
What can be more eye-catching than smooth, interactive, three-dimensional map animation? Impress your visitors by displaying...

