


What can be more eye-catching than smooth, interactive, three-dimensional map animation? Impress your visitors by displaying your map data in stunning 3D!
Previously we have compared OpenLayers and Leaflet map libraries. Both are great choices if you want to add interactive map to your website. They are free, battle-tested, extensible and supported by active communities.
But what if you need a very fast, animated, eye-catching 3D map? Both Leaflet API and OpenMapLayersAPI do not support 3D and free-form map rotation. In this case Mapbox GL map library can be a great option.
Mapbox GL JS is one of the most advanced JavaScript map rendering libraries when it comes to smooth interactive animation. Mapbox GL API is slightly harder to use and not compatible with existing Leaflet plugins and examples. But it is using hardware-accelerated WebGL technology to dynamically draw data with the speed and smoothness of a video game.
Update February 2021: Mapbox GL has changed to a non-free licence, we recommend using MapLibre GL or alternatives instead.
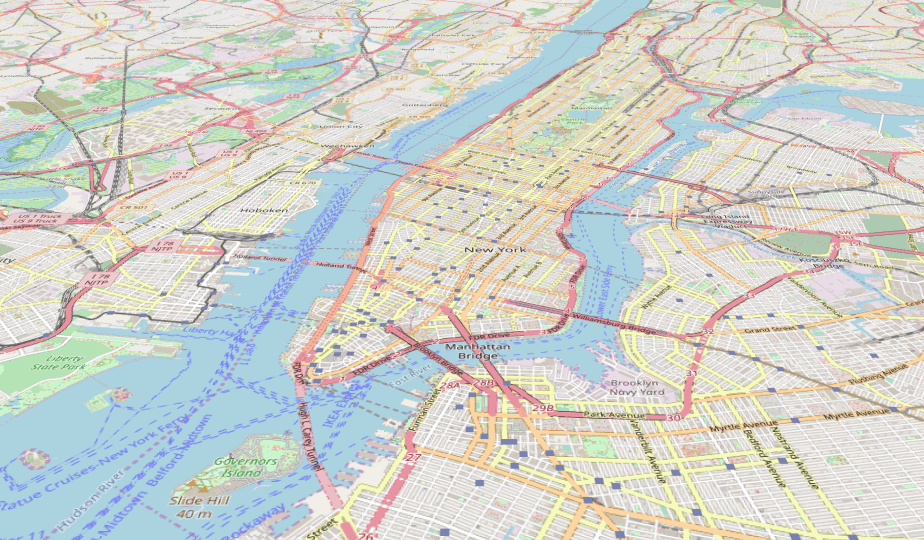
In this article I'll show you how to animate and implement 3D map rotation around a selected point. The end result should look like this:
If you short on time and just looking for the complete HTML code, you can find it at the bottom of the page.
Setting up our 3D map
As first step, we need to add imports for Mapbox GL library and its CSS style sheet into the HEAD of our page
<link
  rel="stylesheet"
  href="https://cdnjs.cloudflare.com/ajax/libs/mapbox-gl/0.53.1/mapbox-gl.css"
/>
<script src="https://cdnjs.cloudflare.com/ajax/libs/mapbox-gl/0.53.1/mapbox-gl.js"></script>
Once imported, we can define a <div> element which will host map visualization and add Javascript code which will initialize Mapbox GL to render our map in 3D with specified initial location, zoom, pitch and bearing.
Please do not forget to put your real API key instead of "YOUR_API_KEY" placeholder in the map tiles URL.
<div id="map"></div>
<script>
  var map = new mapboxgl.Map({
      container: 'map',
      style: "https://maps.geoapify.com/v1/styles/osm-carto/style.json?api_key=YOUR_API_KEY",
      center: [-73.991462, 40.724637], // starting position
      zoom: 12, // starting zoom
      pitch: 60, // starting pitch in degrees
      bearing: 0, // starting bearing in degree
  });
</script>
This should give us basic interactive 3D map. You should be able to move the map to a different locations, zoom in and out, and change view angle.
Adding map rotation animation
As next step, let's add dynamic map animation, which will change view angle to create effect of flying around the map center.
Please add the following code into our <script> block and refresh the page:
function rotateCamera(timestamp) {
  // rotate at approximately ~10 degrees per second
  map.rotateTo((timestamp / 100) % 360, { duration: 0 });
  // request the next frame of the animation
  requestAnimationFrame(rotateCamera);
}

map.on("load", function () {
  // start the animation
  rotateCamera(0);
});
Final steps
As the last step, let's add basic map navigation control. We do not need to add attribution control as it is automatically configured based on the map style.
// map navigation controls
map.addControl(new mapboxgl.NavigationControl());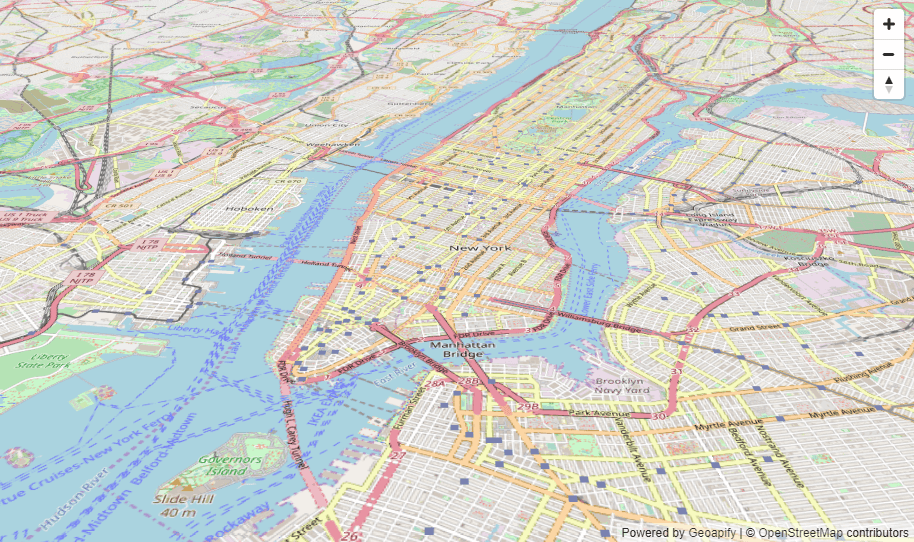
Complete HTML code
Final version of the HTML page could look like this. Please feel free to copy the code, insert API key and open it in your browser to see how it works.
<html>
  <head>
    <meta charset="utf-8" />
    <title>Mapbox GL example: rotate map animation in 3D</title>
    <meta
      name="viewport"
      content="initial-scale=1,maximum-scale=1,user-scalable=no"
    />
    <link
      rel="stylesheet"
      href="https://cdnjs.cloudflare.com/ajax/libs/mapbox-gl/0.53.1/mapbox-gl.css"
    />
    <script src="https://cdnjs.cloudflare.com/ajax/libs/mapbox-gl/0.53.1/mapbox-gl.js"></script>
    <style>
      body {
        margin: 0;
        padding: 0;
      }
      #map {
        position: absolute;
        top: 0;
        bottom: 0;
        width: 100%;
      }
    </style>
  </head>
  <body>
    <div id="map"></div>
    <script>
      var map = new mapboxgl.Map({
          container: 'map',
          style: "https://maps.geoapify.com/v1/styles/osm-carto/style.json?api_key=YOUR_API_KEY",
          center: [-73.991462, 40.724637], // starting position
          zoom: 12, // starting zoom
          pitch: 60, // starting pitch in degrees
          bearing: 0, // starting bearing in degree
      });

      function rotateCamera(timestamp) {
          // rotate at approximately ~10 degrees per second
          map.rotateTo((timestamp / 100) % 360, {duration: 0});
          // request the next frame of the animation
          requestAnimationFrame(rotateCamera);
      }

      map.on('load', function () {
          // start the animation
          rotateCamera(0);
      });

      // map navigation controls
      map.addControl(new mapboxgl.NavigationControl());
    </script>
  </body>
</html>
Summary
Mapbox GL generally requires more JavaScript code to be written than Leaflet and can be more complicated to maintain.
So, you may ask when to use Leaflet and when to use Mapbox GL?
The answer is simple - if you don't need 3D and extremely fast animation then Leaflet would be the best choice. It has biggest community, best documentation, extensive set of plugins and works well in any situation. And if you really need advanced 3D maps with animations and top rendering speed on modern devices - then Mapbox GL is your friend.
Check our article where we compare features of Mapbox GL (Maplibre), Leaflet and OpenLayers libraries and make a right choice for your app.


