


Alternative projections are already practical for global data visualization, but conventional interactive basemaps remain strongly oriented around Web Mercator. Renewed interest in Equal Earth raises a useful question for developers: can an existing web map change projection as easily as it changes style? The answer depends on whether you are transforming coordinates, drawing vector features, or displaying a detailed tiled basemap. Our OpenLayers and D3 demos show why those are different capabilities—and why the right choice also depends on how much of the Earth your map needs to show.
Key takeaways
- Global maps: Equal Earth preserves relative area, making it useful for comparing countries and continents.
- Local maps: Web Mercator remains practical for many street maps, but accurate measurements require appropriate calculations.
- Library support: Coordinate transformation, vector rendering, and tiled basemap support are separate capabilities.
- Basemap readiness: A usable alternative-projection basemap requires compatible source data, tile grids, rendering, and label placement.
On this page
Why Do Projections Matter More for World Maps Than Local Maps?
Projection choice has a greater effect on worldwide visual comparisons because distortion varies across the Earth. Web Mercator (EPSG:3857) enlarges high-latitude regions, making it a poor default when readers should compare the areas of countries or continents. Equal Earth is an equal-area world map projection: it preserves relative area while accepting distortion of shapes, angles, and distances. See the PROJ documentation for Equal Earth.
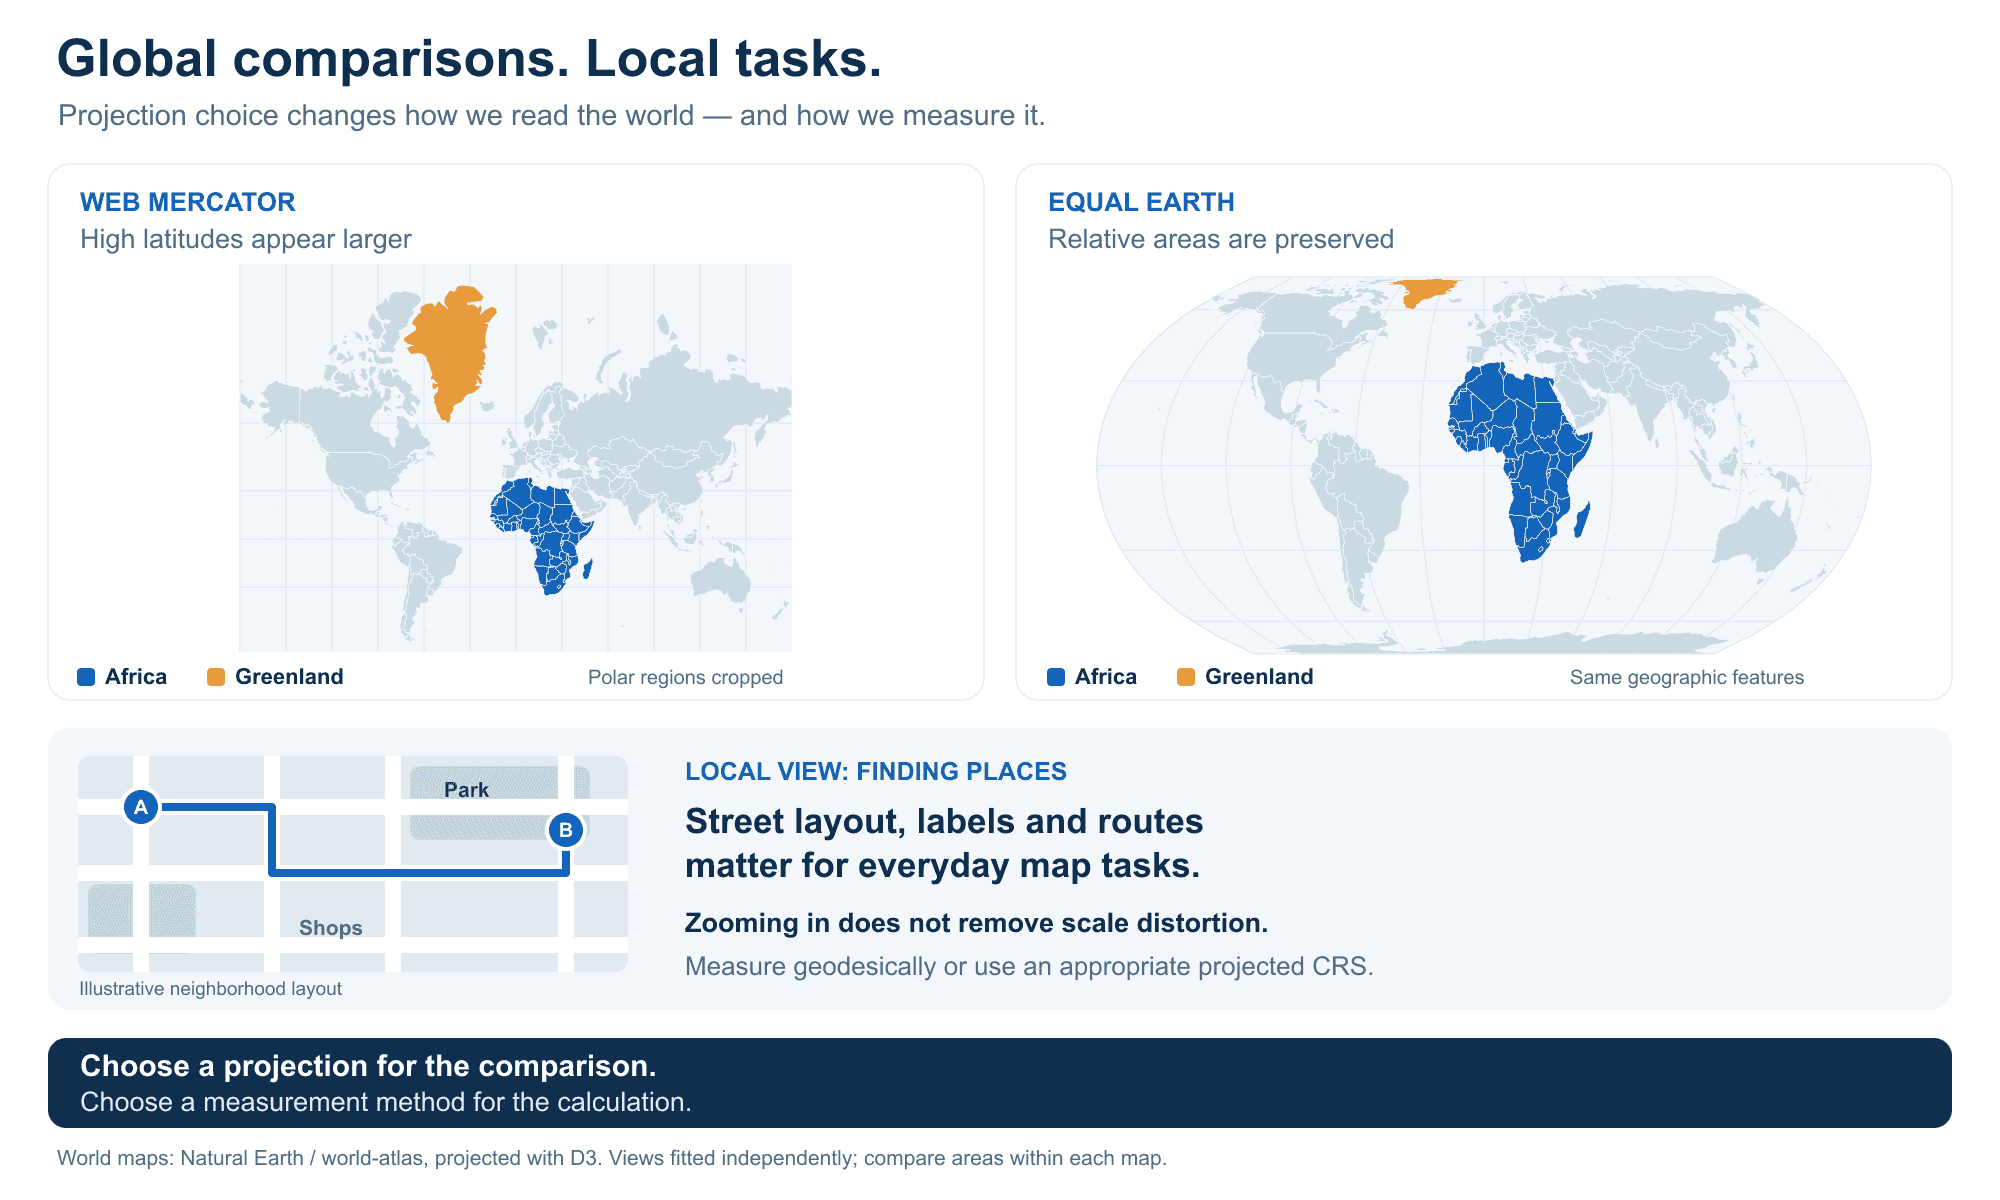
The recent discussion is useful because a familiar basemap is not automatically suitable for every task. The International Cartographic Association's 2026 guidance on world map projections emphasizes choosing a projection for the map's purpose, including equal-area projections when area comparisons matter. Equal Earth is one option; other equal-area and compromise projections suit different presentations.
However, many web maps rarely show the whole planet. A store locator, city delivery map, or neighborhood property search primarily helps people recognize streets and find places. At those scales, differences in the overall appearance of continents are irrelevant, and consistency with the available basemap often matters more.
Local maps still need correct measurements. Zooming in does not remove Web Mercator's scale distortion, especially at high latitudes. Calculate ground distances and areas geodesically or with an appropriate projected coordinate system; do not treat raw EPSG:3857 coordinate differences as accurate ground measurements. Regional analysis, polar coverage, and engineering applications may justify another projection even without a world view.
| Map purpose | Main projection consideration |
|---|---|
| Comparing countries on a world map | Area distortion and the visual weight of regions |
| Global thematic visualization | A projection that supports the message and geographic extent |
| Finding a shop or following a city route | Readable streets, labels, interaction, and basemap availability |
| Measuring land or analyzing a region | Appropriate measurement methods and coordinate systems |
For global data visualization, our guide to thematic maps gives examples of how the visualization itself affects interpretation.
What Does “Projection Support” Actually Mean?
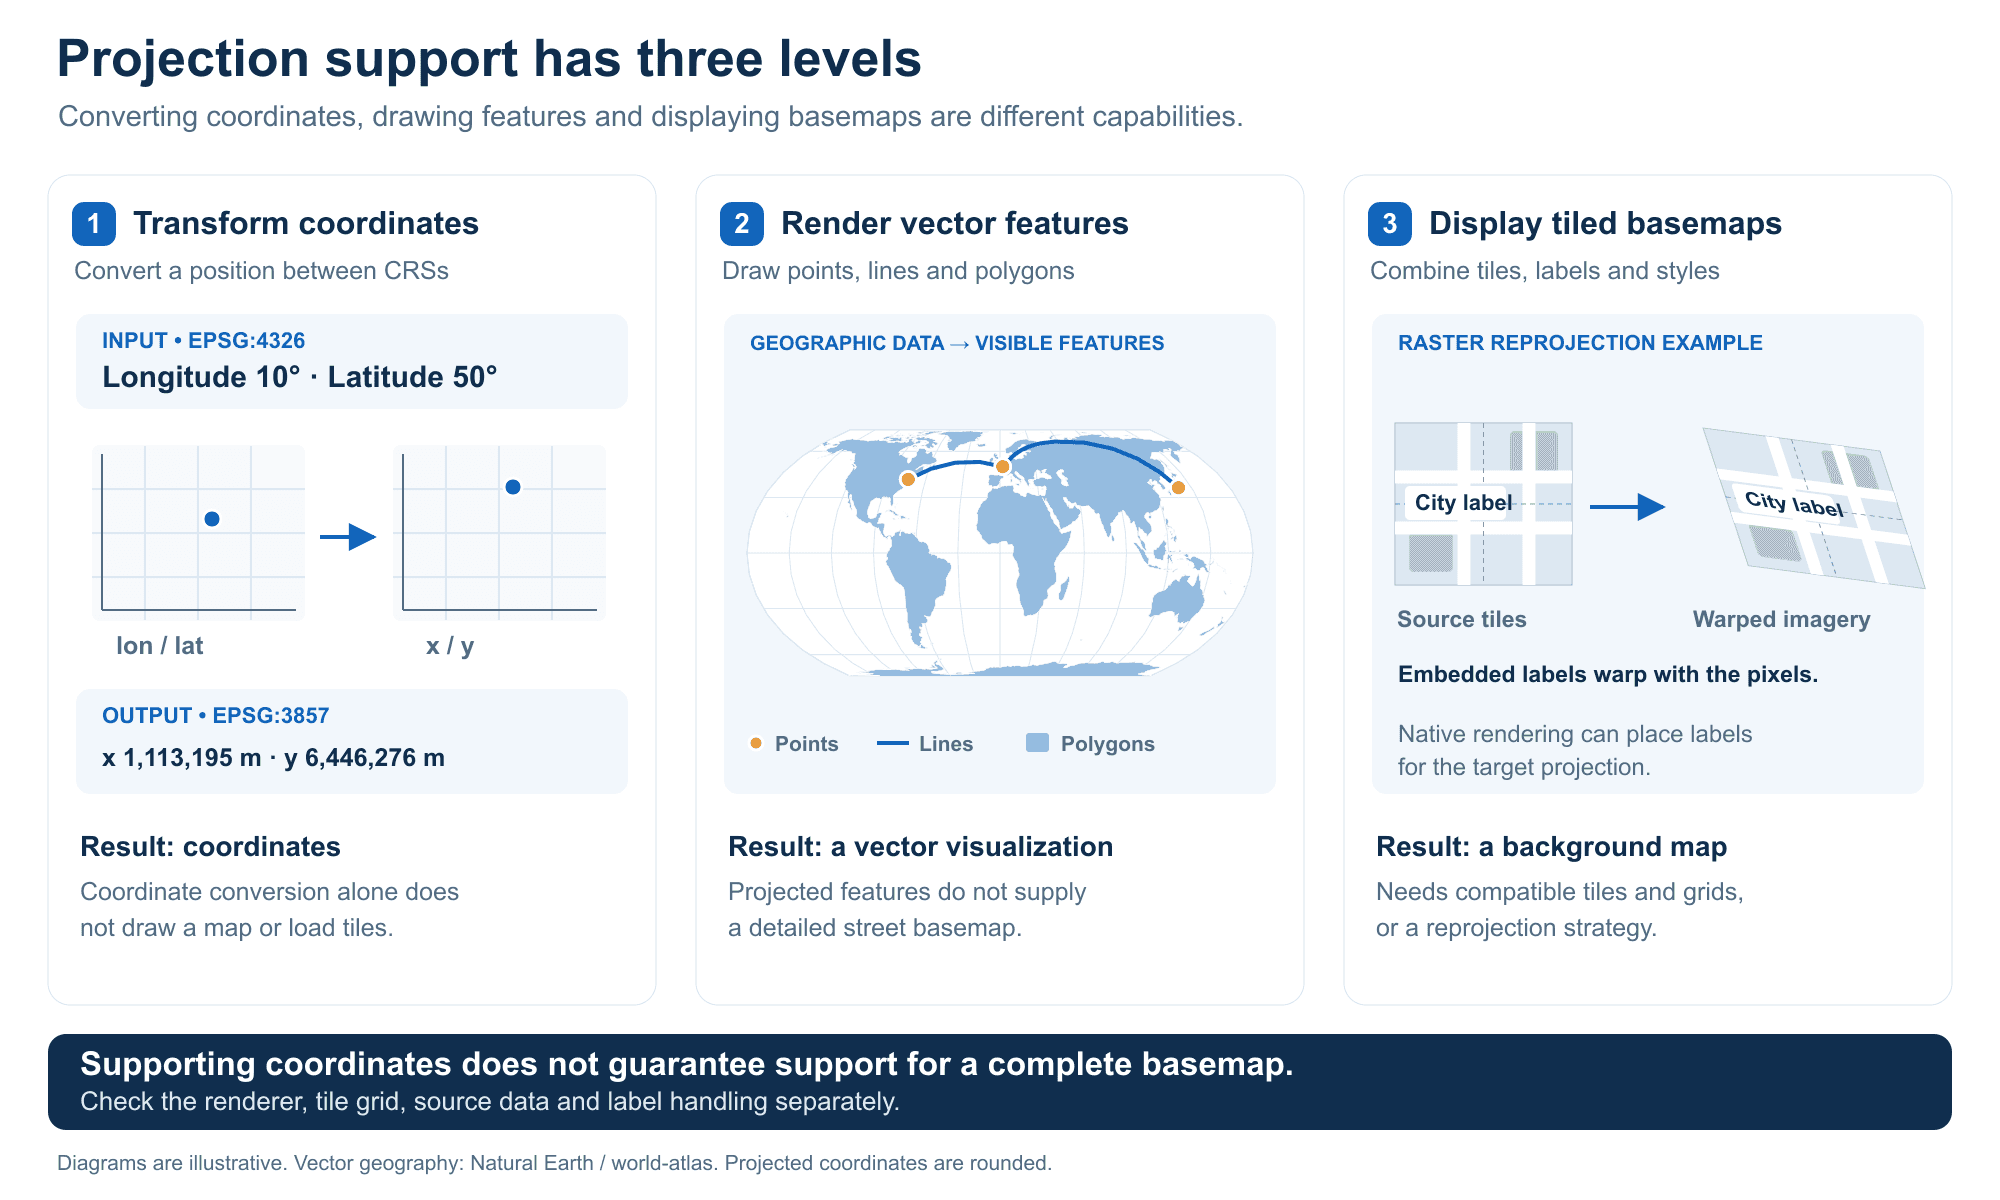
Web-map projection support has three distinct levels: converting coordinates, rendering vector geometry, and displaying tiled basemaps. Support at one level does not guarantee support at the others. A coordinate reference system (CRS) defines how coordinates relate to locations on Earth; a map projection is the mathematical method used to represent the curved Earth on a flat surface.
1. Transforming Coordinates
A coordinate transformation converts a position from one CRS to another—for example, from longitude and latitude to projected x/y coordinates for Equal Earth or a national grid. Coordinate conversion alone does not handle the rendering of curved edges, clipping, labels, or background imagery.
2. Rendering Vector Features
Vector rendering turns points, lines, and polygons into visible geometry in the chosen projection. World maps also need sensible handling of the antimeridian, projection boundaries, and curves between coordinates.
This is enough for many global visualizations: draw country boundaries, color them by a value, and add points or flows. You can create a useful interactive map without a conventional street basemap.
3. Displaying Tiled Basemaps
A tiled basemap is a background map delivered in pieces that the application loads for the visible area and zoom level. The tile grid, coordinate system, zoom levels, and content must work with the map view. A renderer may use tiles prepared for that projection, or it may transform existing tiles during rendering.
Raster reprojection resamples an existing map image into another projection, transforming its text and symbols along with the geography. Native tiles for a target projection are prepared using that projection's tile grid. A basemap rendered natively can place labels and choose detail for the target projection before producing the final image.
Which Web Map Libraries Support Alternative Projections?
The main comparison focuses on MapLibre GL JS, Leaflet, OpenLayers, and D3 Geo, separating projection support from basemap availability. Mapbox GL JS is an important additional example, discussed below. These descriptions reflect documented capabilities checked in September 2026.
| Library | Alternative projection support | Practical basemap situation |
|---|---|---|
| MapLibre GL JS | Mercator and globe rendering; no general built-in Equal Earth view | Conventional flat tiled maps remain Mercator-oriented |
| Leaflet | Built-in CRS choices and additional projections through plugins | Projected tiles can work when their CRS and tile grid match the map |
| OpenLayers | Broad CRS support for vectors and raster reprojection | Existing raster tiles can be reprojected, with image-quality tradeoffs |
| D3 Geo | Extensive geographic projections for custom visualization | Conventional tile imagery needs separate handling; projection functions do not warp raster images |
MapLibre GL JS: Mercator and Globe Support
MapLibre GL JS supports Mercator and globe rendering, but does not provide a general built-in Equal Earth view. The MapLibre projection specification documents Mercator and vertical perspective, including a globe preset that transitions toward Mercator as users zoom in.
For a conventional flat MapLibre basemap, Web Mercator remains the practical default. Globe support solves a different presentation need from an equal-area world map; it does not make Equal Earth, Robinson, or a national grid interchangeable view settings.
Leaflet: Alternative CRSs Need Compatible Tiles
Leaflet has built-in CRS options, and Proj4Leaflet adds support for further projections. A Leaflet map can display tiles in a projected CRS when the source, origin, resolutions, and other grid settings are configured consistently.
Changing a Leaflet map's CRS does not automatically reproject ordinary raster tile images. A typical Web Mercator tile URL therefore cannot simply be reused with any desired projection. Leaflet needs compatible tiles or a service that produces them.
OpenLayers: Strong Projection Support, Including Raster Reprojection
OpenLayers supports a broad range of projection workflows, including additional CRSs registered through Proj4. Vector data can be transformed into the view projection; the official Equal Earth GeoJSON example demonstrates a world map built from vector features.
OpenLayers can also reproject raster tiles in the browser, allowing the basemap source and map view to use different CRSs. The demo below illustrates the visual tradeoffs.
D3: A Strong Fit for Global Geographic Visualization
D3 Geo's projection system works particularly well for world maps, thematic graphics, and custom geographic interaction. It turns geographic geometry into paths while handling projection-specific clipping and resampling.
D3 does not automatically supply the layers and behavior of a conventional street-map application. Its projection functions also do not reproject raster images. The separate d3-tile utility helps calculate visible tiles; it is not inherently restricted to one display technique, but neither is it an image-warping engine. The common tile services used with it still generally supply Web Mercator imagery.
Mapbox GL JS: Alternative Projections with Tiled Sources
Mapbox GL JS is an important exception to the idea that alternative projections are practical only for standalone vector visualizations. It supports Equal Earth, Natural Earth, Winkel Tripel, and other projections with tiled sources. Its adaptive projections gradually transition toward Web Mercator as users zoom in, and some features, including 3D terrain and custom layers, have projection-specific restrictions. This demonstrates that alternative-projection tiled maps are already possible, although their behavior and available features depend on the renderer. See the Mapbox GL JS projection guide.
For broader library selection beyond projections, see our web map library comparison.
How Do the OpenLayers and D3 Equal Earth Demos Differ?
The OpenLayers demo reprojects Geoapify raster tiles into Equal Earth; the D3 demo switches from raster tiles to Natural Earth vector geography. Both demos let you choose a projection, but they do not display identical source data in Equal Earth. The screenshots below were captured from the linked examples; the short code patterns explain the approach rather than reproduce the complete demo source.
Try the comparison yourself:
- Open the OpenLayers demo and the D3 demo. Start in Mercator mode, then select Equal Earth in each.
- Compare place labels, roads, and country outlines. OpenLayers retains the raster basemap; D3 replaces it with Natural Earth vector geography.
- Zoom in and pan toward the map edges. Inspect raster-label stretching in OpenLayers and the available geographic detail in D3. Changing projection does not give the D3 vector dataset the roads and labels of a street basemap.
OpenLayers: Keep the Raster Basemap and Reproject It
Open the OpenLayers projection switcher on CodePen and switch from Web Mercator to Equal Earth. The source remains a Geoapify raster basemap in EPSG:3857; OpenLayers transforms the imagery into the selected view projection.
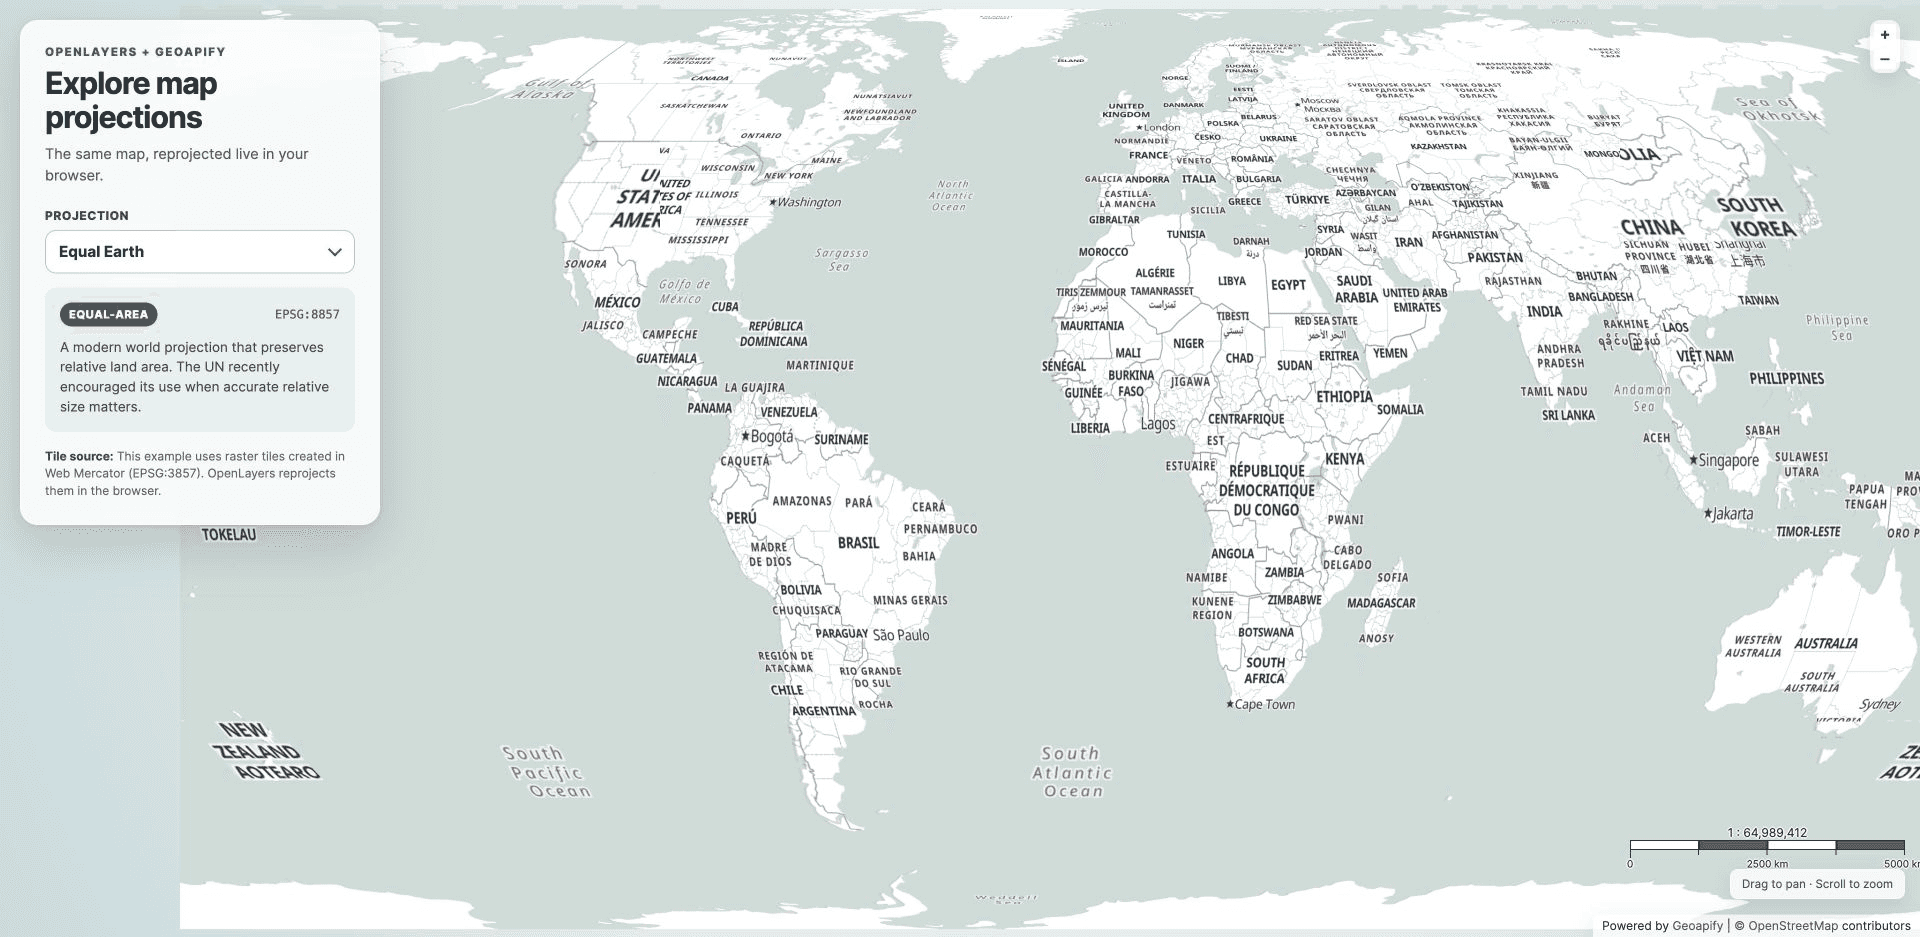
The raster tiles look visibly stretched in this example, including their labels and symbols. Those labels are already part of the image, so reprojection transforms them along with the geography instead of laying out fresh text. This stretching is an expected consequence of raster reprojection, not by itself a software bug. The demo explains the mechanism, but this world view would need further cartographic work to become a polished production basemap.
Vector tiles offer a possible improvement because geometry and labels can be rendered separately. OpenLayers demonstrates vector-tile reprojection into a North Pole Lambert Azimuthal Equal Area view. A 2026 bug report describes incorrect geometry when panning and zooming near that projection's antipodal region. The report documents a specific reprojection edge case; it does not establish widespread failures in Equal Earth or vector-tile rendering generally. Test the intended projection, geographic extent, styles, and zoom levels before relying on the result.
The important configuration is the separation between the source projection and the view projection. This simplified fragment assumes EPSG:8857 has already been registered with Proj4 and its extent configured; use the CodePen for the complete setup.
const basemap = new ol.layer.Tile({
  source: new ol.source.XYZ({
    url: "https://maps.geoapify.com/v1/tile/osm-bright/{z}/{x}/{y}.png?apiKey=YOUR_API_KEY",
    projection: "EPSG:3857",
    crossOrigin: "anonymous"
  })
});

const view = new ol.View({
  projection: "EPSG:8857", // Equal Earth, registered beforehand
  center: [0, 0],
  zoom: 1
});
Raster reprojection remains useful for combining existing imagery with projected data, especially within a suitable regional extent. The background in this example comes from Geoapify Map Tiles; OpenLayers applies the alternative projection in the browser.
D3: Switch from Mercator Tiles to Projected Vector Geography
The D3 projection explorer on CodePen uses Geoapify raster tiles in Mercator mode and Natural Earth vector geography for alternative projections. In Mercator mode, the demo loads tiles as you pan and zoom.
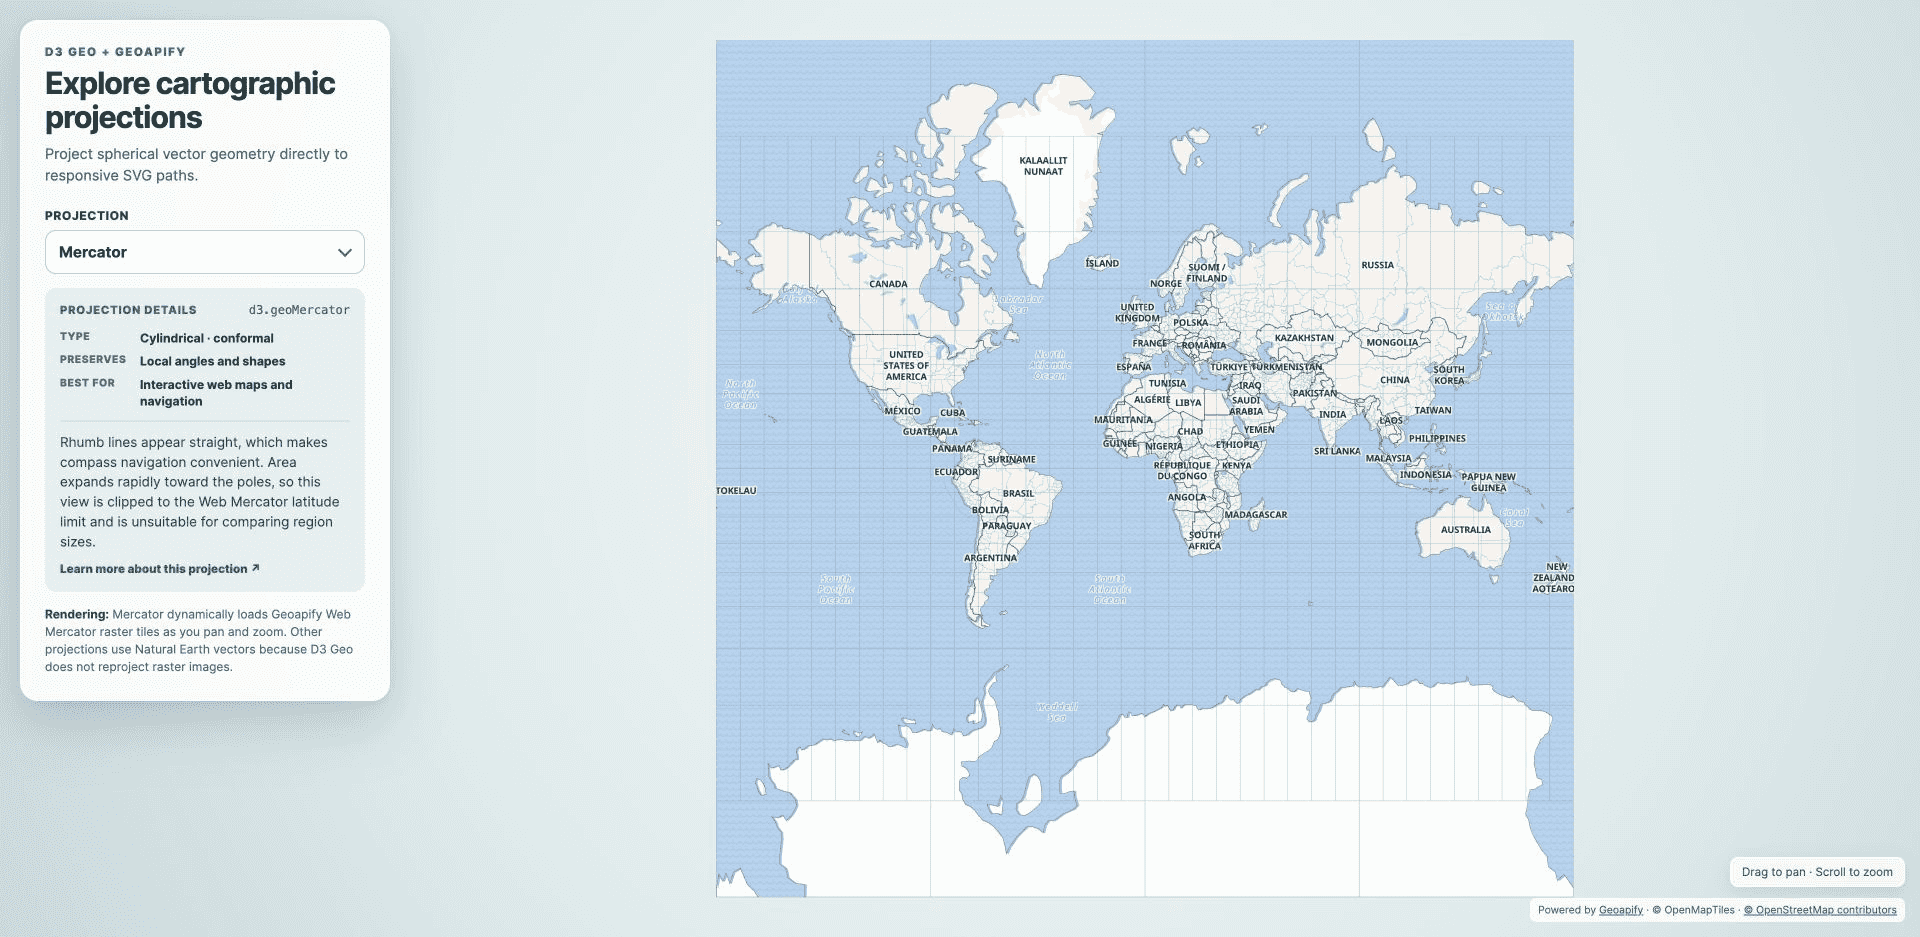
In Equal Earth mode, the D3 demo draws Natural Earth country boundaries and the graticule through the selected projection. The raster basemap is no longer displayed.
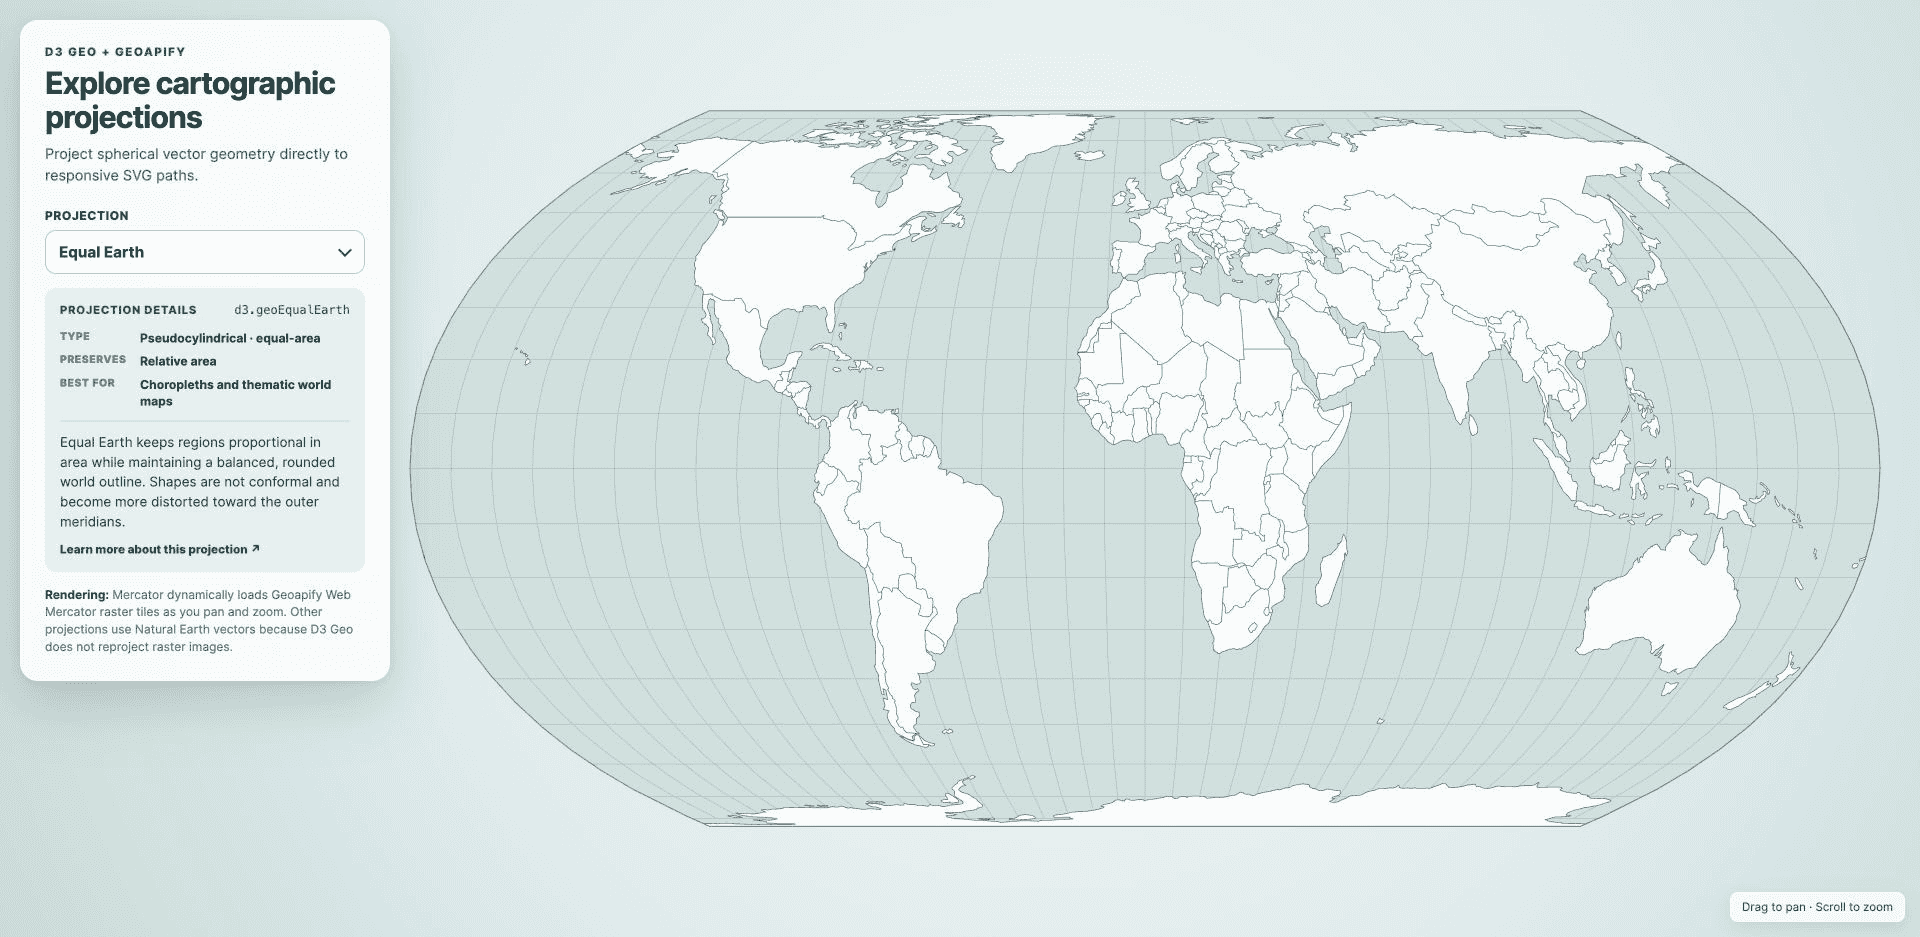
The essential vector-rendering pattern is compact. Here, countries is a GeoJSON FeatureCollection, svg is a D3 selection, and width and height are the drawing dimensions:
const projection = d3.geoEqualEarth()
  .fitExtent(
    [[20, 20], [width - 20, height - 20]],
    { type: "Sphere" }
  );

const path = d3.geoPath(projection);

svg.selectAll("path.country")
  .data(countries.features)
  .join("path")
  .attr("class", "country")
  .attr("d", path)
  .attr("fill", "#e4eee9")
  .attr("stroke", "#426b64");
D3's vector-rendering approach suits a choropleth, a global coverage map, or a set of geographic markers. The geometry can be drawn cleanly at the display resolution, and the visualization can choose its own labels and interaction.
The Natural Earth background supplies less street-level detail than the Geoapify tiled basemap. Its clean appearance demonstrates the benefits of drawing vector geometry, but does not establish that D3 renders an identical basemap better than OpenLayers.
Why Is the Tiled Basemap Ecosystem Still Oriented Around Web Mercator?
The tiled basemap ecosystem remains oriented around Web Mercator because common tile grids, data pipelines, styles, and delivery services are configured to work together in that projection. Adding an Equal Earth view to a JavaScript library addresses only the rendering part of that system. A complete basemap also needs compatible data preparation and delivery.
| Part of the system | What an alternative projection needs |
|---|---|
| Tile grid | Defined extent, origin, resolutions, and rules for addressing tiles |
| Raster content | Native rendering in the target projection, or resampling existing images |
| Vector tile preparation | Compatible geometry, clipping, simplification, and feature selection |
| Styles and labels | Suitable scale rules, symbol placement, and label collision handling |
| Tile server | Support for the target grid and projection, or a reprojection service |
| Caching | Separate tile sets or cache keys for each supported grid and projection |
There is an important distinction between a format and its usual implementation. XYZ addressing does not itself require Web Mercator, and vector tile coordinates do not inherently prescribe a geographic CRS. The Mapbox Vector Tile documentation describes geometry in a local tile coordinate space; the surrounding system establishes how those coordinates relate to the Earth.
In practice, widely available XYZ services, vector tile pipelines, styles, and viewers are commonly configured around Web Mercator conventions. Reusing a familiar {z}/{x}/{y} URL pattern does not make the underlying tile grid compatible with a different projection.
Vector tiles offer more flexibility than finished raster images because geometry and labels can be rendered separately. Still, they are usually already clipped and simplified for a particular tiling scheme and level of detail. A renderer needs a deliberate strategy for transforming that content, handling boundaries, and laying out labels. See our raster versus vector tiles comparison for how these two formats divide work between the server and browser.
Native alternative-projection tiles are possible, and caches can store them. The practical question is whether your chosen providers and tools offer the required combination. Supporting one more projection can mean maintaining another rendering and delivery configuration, not merely adding a projection formula to the client.
How Should You Choose a Projection and Map Library?
Choose a projection for the map's purpose, then select a library and basemap source that support it together. D3 and OpenLayers are practical starting points for global vector visualization; detailed street maps usually have more ready-made basemap options in Web Mercator. Regional maps can use another CRS when their data, tiles, and measurement requirements justify it.
| Your requirement | A practical starting point |
|---|---|
| Compare global patterns or geographic areas | D3 with an appropriate projection and vector geography |
| Show a world map with projected vector layers and standard map controls | OpenLayers with a suitable view projection |
| Combine a regional projected dataset with existing raster imagery | OpenLayers raster reprojection, with visual checks at the intended scales |
| Display a basemap already served in a national or regional CRS | OpenLayers, or Leaflet with the matching CRS and tile grid |
| Use a tiled basemap in Equal Earth with an adaptive zoom transition | Mapbox GL JS, after checking projection-specific feature restrictions |
| Build a typical street map, locator, or delivery interface | A Web Mercator basemap with the library that fits the application |
| Present a globe using a modern tiled-map renderer | MapLibre's globe support, subject to the required layers and interaction |
For global visualization, alternative projections are ready to use today. Equal Earth can be a good choice when relative area matters, while other projections may better suit a region, a viewpoint, or a visual story.
Alternative-projection tiled maps are also possible, as Mapbox GL JS demonstrates, but support is uneven across renderers and the wider ecosystem remains strongly Web-Mercator-oriented. Choose the renderer, source data, tile grid, styling, and delivery infrastructure together: adding a coordinate transformation alone does not produce a complete alternative-projection basemap.
Frequently Asked Questions
What is the difference between coordinate transformation and basemap reprojection?
Coordinate transformation converts positions between coordinate reference systems. Basemap reprojection changes how an entire background map is displayed in another projection. Raster reprojection resamples existing images, including their labels; converting coordinates alone does not provide a complete basemap renderer.
Can I use Equal Earth in an interactive web map?
Yes. D3 Geo and OpenLayers can display interactive vector maps in Equal Earth. OpenLayers can also reproject raster basemaps. Mapbox GL JS supports Equal Earth with tiled sources through an adaptive projection that transitions toward Mercator when zooming in. The appropriate choice depends on the required basemap, interaction, and features.
Does MapLibre only support Web Mercator?
No. MapLibre GL JS supports Mercator and globe rendering. However, globe support does not provide arbitrary flat projections such as Equal Earth. Its conventional flat basemap workflow remains Mercator-oriented. See the MapLibre projection specification.
Can Leaflet display tiles in another projection?
Yes. Leaflet can display non-Mercator tiles when the tile source and map use compatible coordinate reference systems and tile grids. Proj4Leaflet adds further projection support. Changing the map's CRS alone does not reproject Web Mercator raster tiles.
Why do raster labels look stretched after reprojection?
Raster labels are pixels within the source image. Reprojection transforms those pixels along with the map beneath them, so text can stretch or bend. It does not recalculate label placement. Learn how OpenLayers raster reprojection works.
Does D3 reproject Web Mercator map tiles?
D3 Geo's projection functions transform geographic vector geometry, not raster images. In the Geoapify D3 demo, Mercator uses Geoapify raster tiles, while alternative projections use Natural Earth vectors. Reprojecting raster imagery requires additional rendering code or a service. See the D3 Geo projection documentation.
Do XYZ tiles and vector tile formats require Web Mercator?
XYZ tile addressing and vector tile coordinates do not inherently require Web Mercator. However, many tile services and rendering pipelines use Web Mercator grids and conventions. An alternative projection needs a compatible grid, data, and renderer. See the Mapbox Vector Tile documentation for the distinction between tile-local coordinates and geographic coordinates.
Should I replace Web Mercator in a local web map?
Web Mercator remains practical for many local street maps, where basemap readability and availability matter more than world-scale distortion. Zooming in does not remove scale distortion: use geodesic calculations or an appropriate projected CRS for accurate measurements. Consider another view projection for regional analysis, high latitudes, or specific application requirements.