


Maps are often used to visualize statistics. Demographical or socioeconomic data give a great overview of a location and allows to make conclusions about a territory. Often the data is shown are colored regions on the map which represent administrative boundaries or postcode boundaries.
What is the difference between the two types of boundaries?
OK, you have some data and would like to visualize it on a map inside regions. Firstly, you need to decide if you want to show it with administrative boundaries or postcode boundaries. Moreover, you think about how to combine/split up into bigger/smaller regions.
At the moment there are 2 common ways to break down a territory into regions:
- by postcode or ZIP code boundaries;
- by administrative boundaries.
For both cases, you need to keep in mind that a number of hierarchy levels may be different from country to country. Mixing the two options is also a bad idea, while then regions may intersect for some locations.
Postcode boundaries to visualize the data
So, you decided to visualize the data by postcode or ZIP code boundaries. This may be the simplest way to split the data by regions. But there are a few details you need to consider.
Firstly, you need to understand that postcodes are not translated into polygons in some standard way. Originally it's service routes, which are represented as points or street sides. However, there approximated polygons for the post- or ZIP codes boundaries in most GIS data systems, but they may contain holes for some territories.
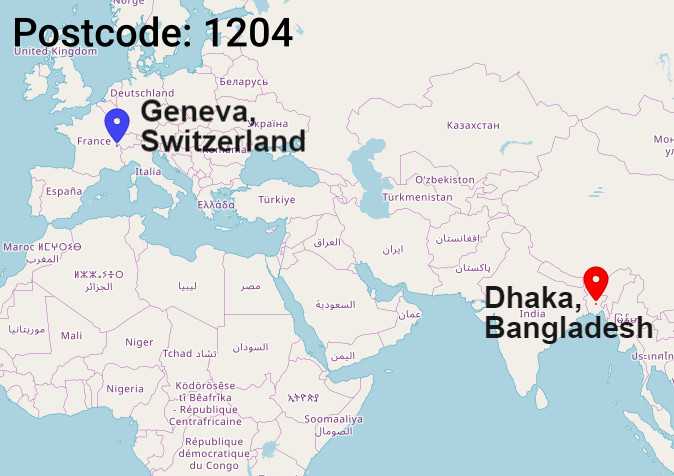
Secondly, don't forget that in most cases postcode should go together with the country name. It could happen that locations in different counties have the same postcode. For example, the postcode 1204 could belong to Geneva, Switzerland or Dhaka, Bangladesh.
Usually, postcode boundaries have 3-4 levels starting from a country level.
Administrative boundaries to visualize the data
This way to divide territories is more natural from the GIS point of view. The planet is already divided into administrative regions. It's possible to combine the data by countries and event by continents.
The administrative division has 3-4 levels from county level depending on the size of the territory.
Drawing boundaries on a map and performance
It often happens that GIS data has big volumes. It may badly impact browser performance when you keep too many polygons data in memory. Following a simple strategy may decrease the risk and make data visualization fast:
- Keep in memory only regions which are visible for a viewport and release memory for non-visible ones
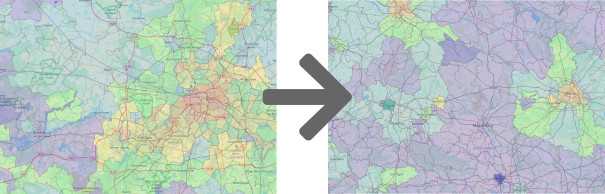
- To avoid having too many small polygons on the map, replace children polygons by a bigger parent polygon when the user zooms out
- Use the level of details you need. Do not try to visualize the most detailed polygons
Where to get administrative or postcode boundaries polygons?
There are many ways to get the polygons data:
- the data is open and available to download for some countries
- GIS databases (e.g., OpenStreetMap data) contain boundaries polygons and you can query the data from there
- use API and get update data when you need it
Geoapify offers APIs for administrative boundaries. Register and try it for free.