


When building a web or mobile app with interactive maps, one of the first decisions you'll face is:
Which map library should I use?
The open-source ecosystem offers several powerful options—Leaflet, MapLibre GL, and OpenLayers—each with its own strengths, community, and ideal use cases.
⚠️ Mapbox GL Licensing Update
For years, many developers used Mapbox GL JS. However, in late 2020, Mapbox GL JS switched from an open-source license (BSD) to a proprietary license starting with version 2. This means it’s no longer free to use for all commercial projects.
In response, the developer community created MapLibre GL — a fully open-source fork of Mapbox GL JS v1. It continues to evolve under a permissive BSD-2-Clause license and is widely adopted as the modern alternative for vector map rendering.
In this article, we compare the three major open-source libraries—Leaflet, MapLibre GL, and OpenLayers—based on:
- Development approach and features
- Vector map support
- Community adoption (npm downloads, GitHub stats)
- Popularity trends (Google Trends by region)
Our goal is to help you choose the most suitable tool for your mapping project—whether you're building a simple interactive map or a complex geospatial application.
On this page
Leaflet vs MapLibre GL vs OpenLayers
| Feature / Library | Leaflet | MapLibre GL | OpenLayers |
|---|---|---|---|
| Overview | Lightweight JavaScript library for interactive maps. Great for beginners and simple raster map apps. | Open-source vector maps library based on Mapbox GL JS v1. Ideal for modern, performant, styleable web maps. | Comprehensive mapping toolkit with strong GIS capabilities. Ideal for complex data-driven visualizations. |
| License | BSD-2-Clause | BSD-2-Clause | BSD-2-Clause |
| Vector tiles support | Not supported natively, but possible via plugins (e.g. Mapbox GL Leaflet) | Fully supported, native support for vector tiles and Mapbox Style specification | Fully supported, can render Mapbox styles with ol-mapbox-style |
| Ease of use | Very easy to learn and integrate. Minimal setup required. | Moderate complexity; ideal for developers familiar with web mapping. | Steep learning curve but highly flexible for advanced use cases. |
| Map styles | Raster tiles only | Vector and raster tiles, full support for custom styles. | Vector and raster support, custom styling possible but requires more configuration. |
| Performance | Lightweight, fast for basic maps. | High-performance rendering of vector data and animations. | Efficient but heavier due to feature-rich architecture. |
| Best for | Basic maps, dashboards, static overlays. | Interactive vector maps, dynamic styling, mobile-friendly maps. | Advanced GIS tools, geospatial analysis, data-heavy apps. |
| Performance | Lightweight, fast for basic maps. | High-performance rendering of vector data and animations. | Efficient but heavier due to feature-rich architecture. |
| Mobile support | Good, supports touch and basic interaction | Excellent mobile support; smooth performance on modern devices | Good, but may require optimization |
| 3D support | ❌ Not supported | ✅ Yes (with deck.gl, custom layers) | ❌ Not supported by default |
| Rendering engine | DOM (HTML elements + SVG) | WebGL | Canvas + WebGL |
| TypeScript support | ✅ Community types | ✅ Built-in types | ✅ Built-in types |
| Plugins / ecosystem | ✅ Rich plugin ecosystem | Moderate but growing | Moderate, core features often cover needs |
| Active development | Slow / stable | Actively maintained by community | Actively maintained by core team |
| Community size | Large, long-standing | Growing quickly | Medium, strong among GIS developers |
| Best for | Basic maps, dashboards, static overlays. | Interactive vector maps, dynamic styling, mobile-friendly apps. | Advanced GIS tools, geospatial analysis, data-heavy apps. |
| Geoapify compatibility | ✅ Yes | ✅ Yes | ✅ Yes |
| Code samples | Leaflet Sample | MapLibre Sample | OpenLayers Sample |
The table highlights how Leaflet stands out for its simplicity, small size, and zero dependencies, making it ideal for lightweight use cases. MapLibre GL offers powerful vector map rendering with modern styling via WebGL, while OpenLayers provides the most comprehensive GIS functionality, albeit with a steeper learning curve and heavier footprint. All three libraries support integration with Geoapify map tiles and have solid TypeScript support and active development communities.
Leaflet Has Zero NPM Dependencies — Why That’s a Good Thing
One of Leaflet’s most unique technical advantages is that it has zero npm dependencies. Unlike many modern JavaScript libraries that pull in a range of third-party packages, Leaflet is entirely self-contained.
This brings several practical benefits:
- Faster and cleaner installation – no nested dependency trees or package bloat
- Fewer security risks – fewer third-party packages mean fewer potential vulnerabilities
- Less chance of breaking changes – no indirect dependencies that may introduce issues during upgrades
- Simpler maintenance – especially valuable for long-lived apps, legacy systems, or secure environments
For developers building lightweight, embedded, or low-maintenance applications, this independence can make Leaflet a highly appealing choice.
NPM Trends for Map Libraries
One of the easiest ways to gauge the popularity and usage of JavaScript libraries is by looking at npm download statistics. These numbers give insight into how many projects rely on each library and how their adoption evolves over time.
We used npmtrends.com to compare downloads of the following packages:
leafletmaplibre-glol(the official npm package for OpenLayers)
📈 Overall Trends (Last 2 Years)
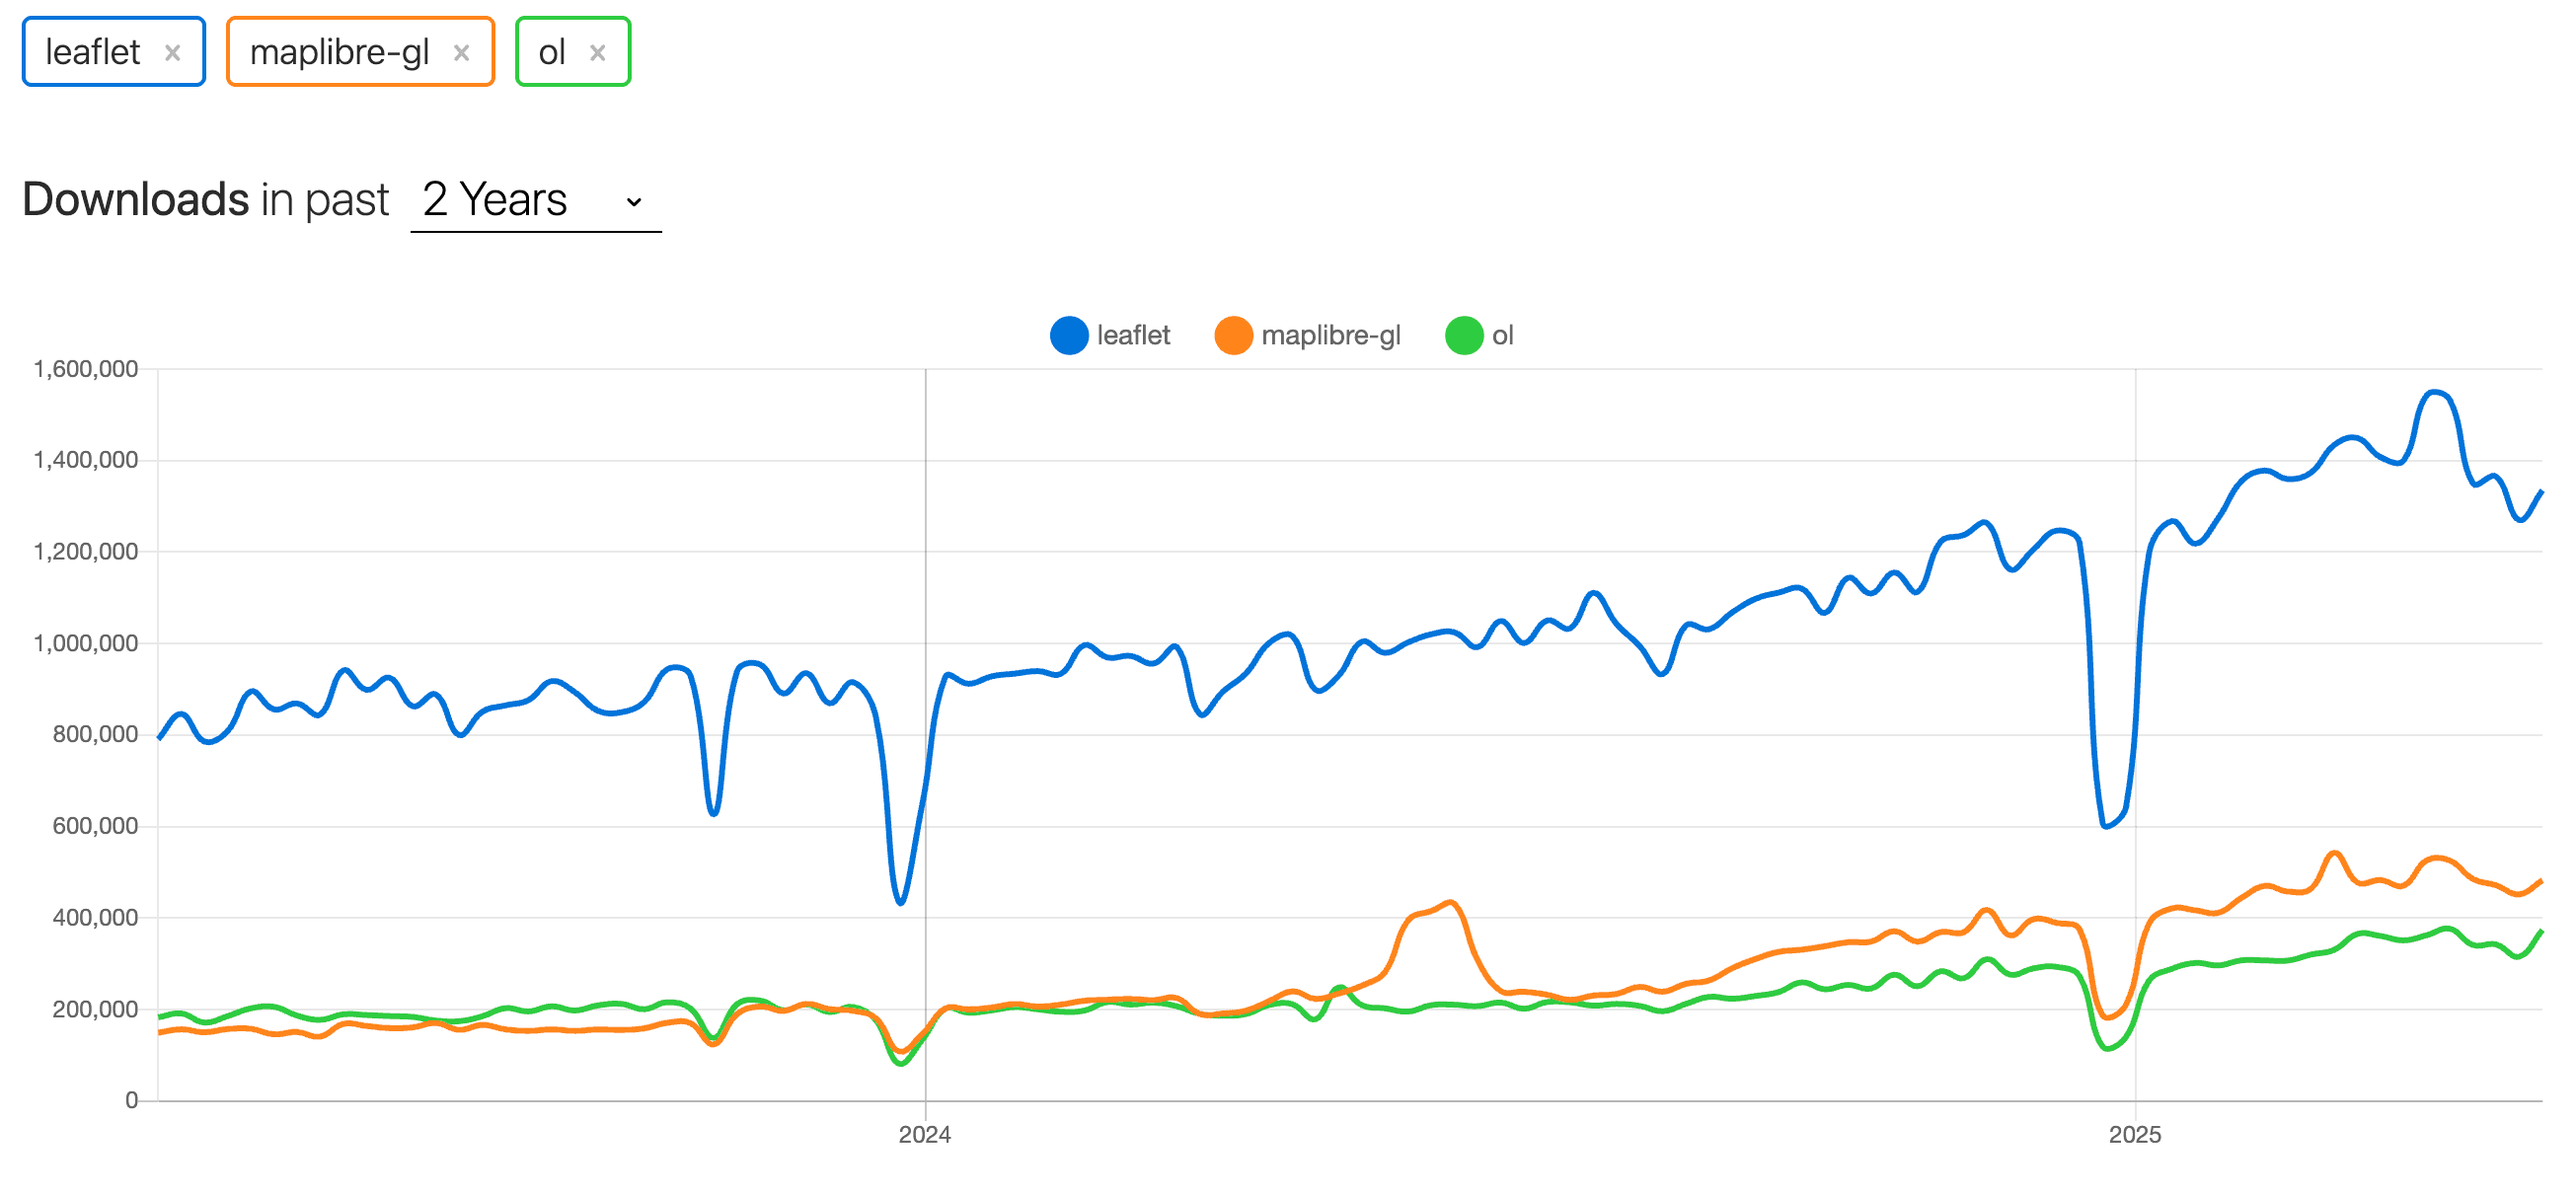
- Leaflet remains the most downloaded map library by a wide margin, averaging over 1.4 million downloads per month in early 2025. Its simplicity and reliability keep it popular for dashboards, CMS plugins, and light mapping tasks.
- MapLibre GL shows a clear growth trend, especially noticeable from mid-2024 onward. After an initial spike, its usage continues to rise steadily, driven by the demand for open-source vector maps and Mapbox GL alternatives.
- OpenLayers maintains stable and consistent usage, indicating its continued relevance in professional and GIS-heavy projects.
A Broader Trend: Growing Interest in GIS
Looking beyond individual libraries, the overall increase in downloads — especially for MapLibre GL and OpenLayers — points to a growing interest in geospatial development and GIS functionality across the web development community. As applications become more location-aware and data-driven, developers are clearly seeking out flexible, powerful mapping tools.
GitHub Statistics: Stars, Forks, and Community Activity
While npm downloads reflect usage, GitHub metrics provide insight into community size, contribution levels, and project maturity. Here’s how the three libraries compare across key signals:
| Library | GitHub Repo | ⭐ Stars | 🍴 Forks | 👥 Contributors | 🛠️ Activity |
|---|---|---|---|---|---|
| Leaflet | Leaflet/Leaflet | ~42.7k | ~5.9k | 800+ | Low (maintenance mode) |
| MapLibre GL | maplibre/maplibre-gl-js | ~7.6k | ~800 | 500+ | High (active releases, roadmap-driven) |
| OpenLayers | openlayers/openlayers | ~11.8k | ~3.1k | 350+ | Medium (frequent updates, GIS focus) |
- Leaflet remains the most starred and forked project, reflecting its long-term popularity and wide adoption. However, it is now in low-maintenance mode, with few major changes.
- MapLibre GL, though younger, shows a rapidly growing developer base and high contributor activity. It’s under active development, with regular releases and clear roadmap planning.
- OpenLayers stands out for its mature and stable development, with a strong focus on GIS-specific features and solid contributor involvement.
These metrics provide a helpful complement to usage statistics, especially for teams evaluating long-term support, responsiveness, and technical sustainability.
Google Trends: Interest in Leaflet, MapLibre GL, and OpenLayers
Google Trends gives us a broader look at developer awareness and global interest in map libraries over time. While npm downloads and GitHub stats track actual usage, search volume reflects what developers are exploring, evaluating, or learning.
We compared global search interest for:
leafletmaplibreopenlayers
📌 Note: MapLibre GL is a relatively new name (since late 2020), so search volume is still growing. However, its trend is clearly upward, and we expect interest to keep rising as more developers adopt it over Mapbox GL.
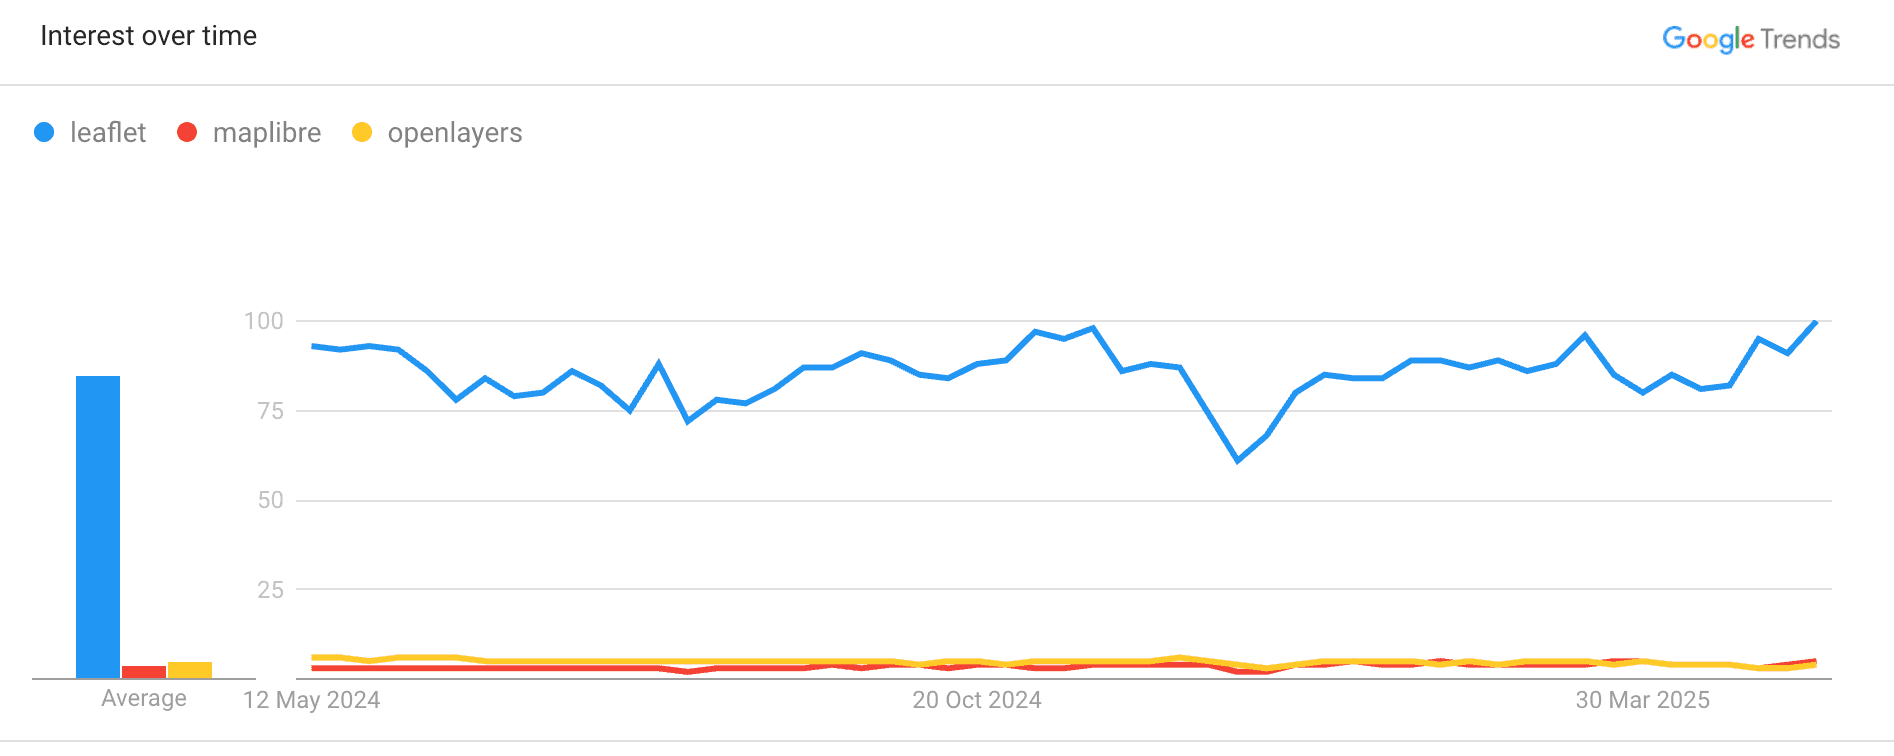
- Leaflet continues to dominate search volume, reflecting its wide recognition and broad use in both personal and commercial projects.
- MapLibre GL is steadily gaining visibility, especially in regions with active open-source and mapping communities.
- OpenLayers shows stable interest, with a consistent baseline over time — indicating continued usage in more specialized or GIS-heavy environments.
Regional Interest: Leaflet, MapLibre GL, and OpenLayers
Search interest in map libraries varies by region, and Google Trends helps identify where each tool is gaining traction. While the values aren't true percentages, they can be interpreted as relative popularity — with 100% representing the peak interest for that term in a given country.
Leaflet
Leaflet reaches 100% relative search interest in many countries including Ireland, Malta, and Cyprus. This means it is the most searched mapping library term in those places. Leaflet is widely known and often chosen as a default library due to its simplicity and long-standing presence in the developer ecosystem.
MapLibre GL
MapLibre GL is gaining attention in countries like Japan (17%), Norway (16%), Germany (13%), and Switzerland (13%). While these figures are still modest compared to Leaflet, they reflect a growing awareness of MapLibre as an open-source replacement for Mapbox GL. Its adoption is rising steadily in regions with strong open-source and tech communities.
OpenLayers
OpenLayers shows strong interest in South Korea (29%), China (26%), Finland (23%), and Russia (23%). These higher percentages indicate regional preference for OpenLayers, often driven by GIS-heavy applications in academic, governmental, or enterprise environments. Its search interest is smaller globally, but concentrated and consistent in its core markets.
When to Choose Which Library
Each map library has its strengths. Here’s a quick guide to help you decide which one fits your project best:
Choose Leaflet if:
- You’re building a lightweight map with basic interactions and overlays.
- You want a quick and easy integration with minimal setup.
- You value zero dependencies, a small bundle size, and fast load times.
- You don’t need vector tiles or advanced rendering features.
- You’re working on dashboards, CMS integrations, or static sites.
Choose MapLibre GL if:
- You need modern vector map rendering with smooth animations and dynamic styling.
- You’re migrating from Mapbox GL and want a fully open-source alternative.
- You care about performance, mobile support, and custom styling via Mapbox Style Spec.
- Your project involves real-time data, thematic layers, or interactive maps.
- You want a future-proof solution with active community development.
Choose OpenLayers if:
- You’re building GIS-level applications or need complex spatial analysis.
- You require fine control over map projections, layers, and features.
- Your app works with WMS, WFS, GeoJSON, or other geospatial standards.
- You have experience with geospatial concepts and want maximum flexibility.
- Your use case is scientific, government, or enterprise-grade mapping.
Tutorials & Code Samples
To help you get started quickly, we’ve prepared a collection of hands-on examples and step-by-step tutorials. Whether you’re using Leaflet, MapLibre GL, or OpenLayers, you’ll find ready-to-use templates and practical integrations for various frameworks.
Code Samples
| Library | Sample |
|---|---|
| Leaflet | Leaflet Sample |
| MapLibre GL | MapLibre Sample |
| OpenLayers | OpenLayers Sample |
These code samples show how to load Geoapify Map Tiles, add layers, and integrate map events using each library.
Framework-Specific Tutorials


How to use Map Libraries in Angular


Angular + Leaflet: step by step tutorial to add a map


React + Leaflet: project template and step by step tutorial
These tutorials walk you through setting up an interactive map, customizing styles, and integrating Geoapify APIs into your frontend projects.
Conclusion
Each map library—Leaflet, MapLibre GL, and OpenLayers—offers unique advantages depending on your needs:
- Leaflet is ideal for simple, lightweight interactive maps and quick integrations.
- MapLibre GL provides high-performance vector rendering and custom styling for modern, dynamic applications.
- OpenLayers is perfect for advanced GIS features, geospatial analysis, and enterprise-level mapping projects.
No matter which library you choose, you can use Geoapify Map Tiles as your base layer. Geoapify offers both vector and raster tiles, optimized for compatibility with all major map libraries. With multiple styles, high availability, and global coverage, it's a solid foundation for any mapping application.
Explore Geoapify’s API documentation for ready-to-use code samples and get started with your own interactive map today.
FAQ
Can I use Geoapify Map Tiles with Leaflet, MapLibre GL, and OpenLayers?
Yes, Geoapify Map Tiles are fully compatible with all major libraries — Leaflet, MapLibre GL, and OpenLayers. You can find code samples in our API Playground.
Is MapLibre GL really free to use?
Yes. MapLibre GL is licensed under the permissive BSD-2-Clause license. It is a fully open-source fork of Mapbox GL JS v1 and can be used in both personal and commercial projects without fees. Learn more at maplibre.org.
What are the advantages of Leaflet having no dependencies?
Leaflet’s zero-dependency design means faster installation, fewer security risks, and better performance — especially useful for lightweight projects or embedded environments.
How can I switch from Mapbox GL to MapLibre GL?
Migrating is usually straightforward. Since MapLibre GL is a fork of Mapbox GL JS v1, most of your code and styles will work with minimal changes. Check the official MapLibre migration guide for details.
Do Geoapify APIs support vector tiles?
Yes. Geoapify provides vector tiles compatible with the Mapbox Style Specification, which you can use with MapLibre GL and OpenLayers via the appropriate style plugins.
What is the difference between raster and vector tiles?
Raster tiles are static image tiles (e.g., PNG or JPEG), while vector tiles are data-based and rendered client-side. Vector tiles offer smoother interactions, styling flexibility, and better performance on modern devices.
Which map library should I use for GIS features?
If you're building a GIS-style application or need advanced geospatial features like projections, measurements, or WMS/WFS integration, we recommend using OpenLayers.
Do I need an API key to use Geoapify Map Tiles?
Yes. All requests to Geoapify APIs and Map Tiles require an API key. You can create a free key here with generous usage limits.


