


GeoJSON is a widely adopted data format for representing geographic information in web development. It provides a simple and flexible way to structure spatial data, making it a popular choice for JavaScript developers working with geospatial data.
In addition, many APIs and services, including Geocoding API, Boundaries API, and Isolines API, return data in GeoJSON format, reinforcing its significance.
In this guide, we'll explore GeoJSON's fundamentals, learn how to work with it using JavaScript (with or without third-party libraries), and discover how to visualize GeoJSON features on maps using popular libraries like Leaflet or MapLibre GL.
What is GeoJSON?
GeoJSON is a data format designed explicitly for representing and working with geographical objects in a structured and standardized manner. It was meticulously developed with the needs of developers in mind, catering specifically to those who work extensively with geospatial data.
At its core, GeoJSON revolves around the concept of features, which are individual geographic entities. A Feature represents a single geographic entity and combines properties (any additional information or attributes) with geometries:
{
  "type": "Feature",
  "properties": {
    "name": "Museum aan de Stroom",
    "country": "Belgium",
    "country_code": "be",
    "region": "Flanders",
    "state": "Antwerp",
    "city": "Antwerp",
    "postcode": "2000",
    "street": "Hanzestedenplaats",
    "housenumber": "1",
    "lon": 4.404732087,
    "lat": 51.22893535,
    "formatted": "Museum aan de Stroom, Hanzestedenplaats 1, 2000 Antwerp, Belgium",
  },
  "geometry": {
    "type": "Point",
    "coordinates": [
      4.404732087,
      51.22893535
    ]
  }
}
For example, the GeoJSON above represents a GeoJSON Point Feature representing the Museum aan de Stroom location in Antwerp, Belgium. The associated properties provide additional information about the museum, including its name, address, and geographic coordinates.
The Geometry represents the structure and properties of a GeoJSON geometry object. It defines two properties:
-
"type": Specifies the type of the geometry. It can have one of the following values: "Point", "MultiPoint", "LineString", "MultiLineString", "Polygon", "MultiPolygon", or "GeometryCollection". This property indicates the specific shape and structure of the geographic object.
-
"coordinates": Represents the coordinates that define the geometry's shape. The structure of the coordinates property varies based on the geometry type. It can be a one-dimensional array of numbers for a Point, a two-dimensional array of numbers for a LineString or MultiPoint, a three-dimensional array of numbers for a Polygon or MultiLineString, or a four-dimensional array of numbers for a MultiPolygon. The numbers in the array represent the longitude and latitude values or additional dimensions if applicable.
interface Geometry {
  "type": "Point" | "MultiPoint" | "LineString" | "MultiLineString" | "Polygon" | "MultiPolygon" | "GeometryCollection",
  "coordinates": number[] | number[][] | number[][][] | number[][][][]
}
Let's take a closer look at different types of Geometry:
| Type | Picture | Coordinates | Example |
|---|---|---|---|
| Point |
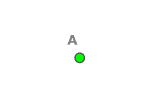
| number[] | [lon_A, lat_A] |
| MultiPoint |
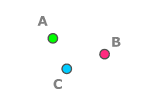
| number[][] | [[lon_A, lat_A], [lon_B, lat_B]] |
| LineString |
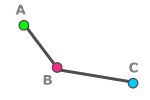
| number[][] | [[lon_A, lat_A], [lon_B, lat_B], [lon_C, lat_C]] |
| MultiLineString |
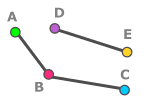
| number[][][] | [[[lon_A, lat_A], [lon_B, lat_B], [lon_C, lat_C]], [[lon_D, lat_D], [lon_E, lat_E]]] |
| Polygon |
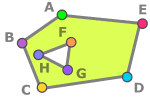
| number[][][] | [[[lon_A, lat_A], [lon_B, lat_B], [lon_C, lat_C], [lon_D, lat_D], [lon_E, lat_E], [lon_A, lat_A]],[[lon_F, lat_F], [lon_G, lat_G], [lon_H, lat_H], [lon_F, lat_F]]] |
| MultiPolygon |
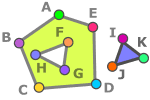
| number[][][][] | [[[[lon_A, lat_A], [lon_B, lat_B], [lon_C, lat_C], [lon_D, lat_D], [lon_E, lat_E], [lon_A, lat_A]],[[lon_F, lat_F], [lon_G, lat_G], [lon_H, lat_H], [lon_F, lat_F]]], [[[lon_I, lat_I], [lon_J, lat_J], [lon_K, lat_K], [lon_I, lat_I]]]] |
When working with the coordinates of a Polygon geometry in GeoJSON, it is important to consider the following specifics:
- Exterior Ring and Interior Rings (Holes): A polygon consists of an exterior ring that defines the main boundary and one or more interior rings (also known as holes) that represent cut-out areas within the polygon. Each ring is represented by an array of coordinate pairs.
- Matching First and Last Coordinates: To ensure a valid polygon, the first and last coordinates of each ring (both exterior and interior) must be the same. This closure ensures that the polygon is properly formed.
- Exterior Ring Direction: The coordinates of the exterior ring should follow a counterclockwise direction. This convention helps distinguish the exterior boundary from the interior rings.
- Interior Ring Direction: In contrast to the exterior ring, the coordinates of interior rings (holes) should follow a clockwise direction. This convention differentiates them from the exterior boundary.
GeoJSON supports one additional geometry type, the GeometryCollection. It allows you to group multiple geometry objects within a single feature. The "GeometryCollection" represents a collection of different geometry types.
Here's an example of a GeoJSON "GeometryCollection" object:
{
  "type": "GeometryCollection",
  "geometries": [
    {
      "type": "Point",
      "coordinates": [4.404732087, 51.22893535]
    },
    {
      "type": "LineString",
      "coordinates": [
        [4.404732087, 51.22893535],
        [4.403982789, 51.229262879],
        [4.403812348, 51.229155607]
      ]
    },
    {
      "type": "Polygon",
      "coordinates": [
        [
          [4.404732087, 51.22893535],
          [4.404982789, 51.229262879],
          [4.404812348, 51.229155607],
          [4.404732087, 51.22893535]
        ]
      ]
    }
  ]
}
JavaScript Libraries for GeoJSON Manipulation
Working with GeoJSON data in JavaScript is made easier by various libraries that provide convenient methods and utilities for manipulating and interacting with spatial data. These libraries empower developers to handle GeoJSON objects effectively, perform spatial operations, and visualize the data on maps.
Let's take a closer look at Turf.js, which is one of the most popular frameworks.
Key Features of Turf.js
Turf.js offers a wide range of features and functionalities that make it a popular choice among developers working with GeoJSON. Here are some key features of Turf.js:
-
Helper Functions: Turf.js provides a variety of helper functions that simplify common tasks, such as creating GeoJSON object and generating random points within a given area, finding centroids, snapping points to nearest features, and extracting specific properties from GeoJSON features.
-
Spatial Operations: Turf.js provides a rich collection of spatial operations, including buffering, intersecting, union, difference, and more. These operations allow you to perform complex geospatial analysis tasks with ease.
-
Measurement Utilities: Turf.js offers a variety of measurement utilities, such as calculating distances between points, determining areas of polygons, finding nearest points, and generating convex hulls. These utilities enable precise measurements and analysis of spatial data.
-
Data Transformation: Turf.js allows you to transform and modify GeoJSON data using functions like conversion between coordinate systems, simplification of geometries, reprojecting coordinates, and more. These transformations facilitate data preparation and optimization for specific use cases.
-
Data Validation: Turf.js includes validation functions to ensure the integrity and validity of GeoJSON geometries. You can use these functions to check for issues like self-intersections, incorrect winding order of polygons, or invalid geometries.
Turf.js code samples
Here are a few code samples showcasing the usage of Turf.js for GeoJSON manipulation and spatial analysis:
Calculating Distance between Two Points:
const point1 = turf.point([4.3548, 51.4436]);
const point2 = turf.point([4.3679, 51.4422]);

const distance = turf.distance(point1, point2);
console.log(`The distance between the two points is ${distance} kilometers.`);
Buffering a Point:
const point = turf.point([4.3548, 51.4436]);
const buffered = turf.buffer(point, 0.2, { units: 'kilometers' });

console.log(buffered);
Finding Intersections between Two Polygons:
const polygon1 = turf.polygon([
  [[0, 0], [0, 10], [10, 10], [10, 0], [0, 0]]
]);

const polygon2 = turf.polygon([
  [[5, 5], [5, 15], [15, 15], [15, 5], [5, 5]]
]);

const intersection = turf.intersect(polygon1, polygon2);
console.log(intersection);
Simplifying a Polygon:
const polygon = turf.polygon([
  [[0, 0], [0, 5], [5, 5], [5, 0], [0, 0]]
]);

const simplified = turf.simplify(polygon, { tolerance: 0.01, highQuality: true });
console.log(simplified);
These examples provide a glimpse of the functionality that Turf.js offers for working with GeoJSON data. With its extensive set of functions and utilities, Turf.js enables you to perform advanced spatial operations, measurement calculations, data transformations, and more. Feel free to explore the Turf.js documentation for a complete list of available functions and their detailed usage instructions.
Getting Started with Turf.js
To start using Turf.js, simply install it via npm or your preferred package manager. Once installed, you can import the desired Turf.js functions into your JavaScript code and begin manipulating GeoJSON data.
For comprehensive guidance on getting started with Turf.js, we recommend you refer to the official Turf.js documentation. The documentation provides clear information, examples, and guidance on how to integrate Turf.js into your Javascript project.
Get GeoJSON Visualized On A Map
Visualizing GeoJSON data on a map is fundamental to working with geospatial data. Fortunately, many popular map libraries offer built-in support for rendering GeoJSON objects, making it easier than ever to integrate your GeoJSON data into interactive maps. Let's explore how you can integrate GeoJSON with some commonly used map libraries:
Leaflet
Integrating GeoJSON data into Leaflet is very straightforward. Take a look at this JSFiddle code sample for a live demo.
First, use the L.geoJSON() method and pass your GeoJSON data as a parameter. Then, add the resulting layer to the map using the addTo() method. Here's an example:
L.geoJSON(geojsonData).addTo(map);Optionally, you can customize the styling and interactivity of your GeoJSON features by providing additional options to the L.geoJSON() method. You can specify different styles, popups, tooltips, or event listeners for your features:
L.geoJSON(geojsonData, {
  style: function (feature) {
    return {
      color: 'blue',
      fillColor: 'yellow',
      weight: 2,
    };
  },
  onEachFeature: function (feature, layer) {
    layer.bindPopup(`Name: ${feature.properties.name}`);
  },
}).addTo(map);
In this example, the GeoJSON features will have a blue border, yellow fill, and a weight of 2. Additionally, each feature will display a popup with its name property when clicked.
That's it! Your GeoJSON data will now be rendered on the Leaflet map. Customize the code according to your specific GeoJSON structure and requirements.
MapLibre GL
With MapLibre GL, you can easily visualize GeoJSON data on a map using sources and layers.
Here you will find the JSFiddle code sample.
- Create a MapLibre GL GeoJSON Source:
Before adding the GeoJSON layer, you need to define a GeoJSON source. Create a GeoJSON source using the addSource() method and specify the data property as your GeoJSON data. For example:
map.addSource(sourceId, {
  'type': 'geojson',
  'data': geojson
});- Create a Layer for the GeoJSON Source:
Once the GeoJSON source is added, you can create a layer to display the GeoJSON data on the map. Use the
addLayer()method to create a new layer and specify the source property as the ID of the GeoJSON source. For example:
map.addLayer({
  'id': fillLayerId,
  'type': 'fill',
  'source': sourceId,
  'paint': {
	'fill-color': '#ff69b4',
	'fill-opacity': 0.1
  }
});
By adjusting the 'fill-color', 'fill-opacity', and other properties, you can customize the appearance of the fill layer to suit your needs.
For more detailed information on working with MapLibre GL layers and their configuration options, you can refer to the MapLibre GL documentation.
Google maps
Google Maps also provides support for integrating and visualizing GeoJSON data, allowing developers to display geographic features such as points, lines, and polygons on their maps with ease.
To add GeoJSON data to a Google Map, you can follow these steps:
- Create a new
google.maps.Dataobject to work with the GeoJSON data:
const dataLayer = new google.maps.Data();- Load the GeoJSON data using the
loadGeoJsonmethod, passing the URL of the GeoJSON file or the GeoJSON object directly:
dataLayer.loadGeoJson('path/to/your/geojson/file.geojson');- Set the map instance where you want to display the GeoJSON data using the
setMapmethod:
dataLayer.setMap(map);By executing these steps, the GeoJSON data will be added to the map as a Data Layer. The map will automatically render the features based on their geometry and properties.
You can also customize the styling of the GeoJSON features using the setStyle method. For example, to change the fill color of the GeoJSON polygons, you can do the following:
dataLayer.setStyle({
  fillColor: 'blue',
  fillOpacity: 0.5
});
This will set the fill color of the polygons to blue with 50% opacity.
For more advanced functionality and manipulation of the GeoJSON data, you can explore the Google Maps Data Layer documentation: Google Maps Data Layer Documentation.
Note that the code snippets provided assume that you have already set up and initialized the Google Map on your page using the Google Maps JavaScript API.
Frequently Asked Questions
What is GeoJSON?
GeoJSON is a data format used for representing geographic objects and collections of objects in JavaScript. It provides a standardized structure for storing spatial data, making it easier to work with geospatial information in web development.
Why is GeoJSON important for JavaScript developers?
GeoJSON has become a standard format for working with geospatial data due to its simplicity, flexibility, and compatibility with JavaScript libraries and APIs. Understanding GeoJSON is crucial for developers building location-based applications, interactive maps, and conducting spatial analysis.
Can I use GeoJSON with third-party APIs and services?
Yes, many APIs and services, such as Geocoding APIs or Routing APIs, return data in GeoJSON format. This makes it easier to integrate and work with geographic data from various sources in your JavaScript applications.
How can I visualize Isoline results using GeoJSON?
Isoline results represent a polygon or a set of polygons that outline an area reachable within a specific distance or time. To visualize Isoline results using GeoJSON, you can create a GeoJSON Polygon or MultiPolygon feature using the coordinates provided in the Isoline response. You can then add this feature to a map using a mapping library to display the isoline area.
Can I style and visualize GeoJSON features on a map?
Yes, mapping libraries like Leaflet, MapLibre GL, and Google Maps allow you to visualize GeoJSON features on a map. You can customize the styling of the features, such as fill colors, stroke widths, and opacity, to create visually appealing and interactive maps.
How can I get started with GeoJSON and JavaScript?
To get started with GeoJSON and JavaScript, familiarize yourself with the GeoJSON format and its structure. Learn how to manipulate and work with GeoJSON data using JavaScript libraries like Turf.js. Experiment with integrating and visualizing GeoJSON on maps using mapping libraries like Leaflet, MapLibre GL, or Google Maps.
Remember, practice and hands-on experience are essential for mastering GeoJSON and harnessing its power in your JavaScript development projects.
How can I use GeoJSON in my JavaScript application?
To use GeoJSON in your JavaScript application, you can include GeoJSON data directly in your code or load it from an external file. Once you have the GeoJSON data, you can parse and manipulate it using JavaScript to extract information, perform spatial calculations, or visualize it on a map.
How can I view a GeoJSON file?
To view a GeoJSON file, you can use various tools and approaches. One option is to open the GeoJSON file in a text editor to examine its structure and contents. Additionally, you can use online GeoJSON viewers or mapping platforms that support the visualization of GeoJSON, such as geojson.io or popular mapping libraries like Leaflet or MapLibre GL.
How can I parse Shapefiles into GeoJSON?
To parse Shapefiles into GeoJSON, you can use libraries and tools specifically designed for this purpose, such as shpjs or togeojson. These libraries provide functions to read Shapefile data and convert it into GeoJSON format, allowing you to access and work with the spatial data in your JavaScript application.
Can I convert GeoJSON to other geospatial data formats, like Shapefile?
Yes, conversion libraries and tools are available to convert GeoJSON to other popular geospatial data formats, such as Shapefile. You can use libraries like shp-write or online conversion services to convert GeoJSON data into Shapefile format, enabling interoperability with other geospatial software or systems.
Conclusion
In conclusion, GeoJSON has become a vital tool for JavaScript developers working with geographic data. Its structured format, compatibility with various libraries and APIs, and ease of integration with popular mapping platforms make it an essential skill to possess.
By understanding the fundamentals of GeoJSON, leveraging powerful libraries like Turf.js, and utilizing mapping libraries such as Leaflet, MapLibre GL, and Google Maps, developers can unlock the full potential of geospatial data visualization and manipulation.
Whether you're building location-based applications, conducting spatial analysis, or creating interactive maps, mastering GeoJSON empowers you to unlock a world of possibilities in geospatial development. So, dive into the world of GeoJSON and elevate your JavaScript development with the power of geographic data integration.