


Creating high-quality printable maps is essential for various applications, from educational materials to decorative wall posters.
The Static Maps API offers a robust solution for generating static, non-interactive maps that can be easily customized and printed in high resolution.
This tutorial will guide you through the process of using the Static Maps API to create beautiful, printable maps. We will cover standard paper sizes, necessary resolutions, API configuration, map style customization options, and practical examples to help you design maps tailored to your specific needs. Whether you're a developer or a map enthusiast, this guide will equip you with the knowledge to produce professional-quality maps for any purpose.
Step 1: Choosing the Map Size for Print
When creating printable maps, understanding the standard paper sizes and their corresponding map sizes is crucial. Different paper sizes are suited for various purposes, from small prints for handouts to large wall posters.
Below, we'll cover some common sizes, their dimensions in inches and millimeters, and the required pixel dimensions for map size (in pixels) and high-quality image at 300 DPI (dots per inch):
| Paper Size | Dimensions (mm) | Dimensions (inches) | Map size (px) | Pixel Dimensions at 300 DPI (scaleFactor=2) |
|---|---|---|---|---|
| A4 | 210 x 297 | 8.3 x 11.7 | 1240 x 1754 | 2480 x 3508 |
| A3 | 297 x 420 | 11.7 x 16.5 | 1754 x 2480 | 3508 x 4961 |
| A2 | 420 x 594 | 16.5 x 23.4 | 2480 x 3508 | 4961 x 7016 |
| A1 | 594 x 841 | 23.4 x 33.1 | 3508 x 4961 | 7016 x 9933 |
| A0 | 841 x 1189 | 33.1 x 46.8 | 4961 x 7016 | 9933 x 14043 |
| 25 x 25 cm | 250 x 250 | 9.8 x 9.8 | 1476 x 1476 | 2953 x 2953 |
| 21 x 30 cm | 210 x 300 | 8.3 x 11.8 | 1240 x 1772 | 2480 x 3543 |
| 40 x 50 cm | 400 x 500 | 15.7 x 19.7 | 2362 x 2953 | 4724 x 5906 |
Many Static Maps APIs, such as Geoapify's Static Maps API, offer options to scale the map images to keep the correct zoom of map images. This scaling feature allows you to generate larger images by using a scaling factor.
For example, using Geoapify's Static Map API, setting the scaleFactor=2 will effectively double the resolution of the map, providing the necessary pixel density for 300 DPI prints. Here's how you can configure the API for a high-resolution A4 map:
https://maps.geoapify.com/v1/staticmap?style=osm-bright&width=1240&height=1754¢er=lonlat:-122.724096,47.606419&zoom=7.7898&scaleFactor=2&apiKey=YOUR_API_KEYIn this example, scaleFactor=2 doubles the output size, resulting in a 1240 x 1754 pixel map suitable for A4 printing at 300 DPI or 2480 x 3508 pixel image.
By understanding the relationship between paper size, map size, and API scaling options, you can ensure your printable maps are of the highest quality and fit perfectly on the intended paper size.
Geoapify also offers higher scaling factor values, available on request, to achieve even higher DPI for larger prints or more detailed images.
Step 2: Choosing Map View
Selecting the right map view is crucial for creating an effective printable map. The Static Maps API offers several parameters to help you define the map's appearance and focus area.
Center and Zoom
The most straightforward method is to specify the map's center coordinates (latitude and longitude) and the zoom level. This approach gives you precise control over the map's focal point and detail level.
In this example, the map is centered on Berlin, Germany, with a zoom level of 10:
https://maps.geoapify.com/v1/staticmap?style=osm-bright¢er=lonlat:13.4050,52.5200&zoom=10&width=620&height=877&scaleFactor=2&apiKey=YOUR_API_KEYAutomatic Map View Based on Area, Markers, or Geometry
Alternatively, the API allows you to set the map view automatically based on a defined area, a set of markers, or specific geometry (such as a route or polygon). This feature is particularly useful when you want the map to encompass all specified elements without manually calculating the center and zoom.
Set by Area:
When searching for cities using the Geocoding API, the API returns a bounding box (bbox). This bbox can be used as an area parameter to generate printable city maps programmatically.
Here is the result of a Geocoding API call for the city of Berlin:
{
  "results": [
    {
      "country": "Germany",
      "city": "Berlin",
      "lon": 13.3888599,
      "lat": 52.5170365,
      "result_type": "city",
      "formatted": "Berlin, Germany",
      "category": "administrative",
      ...
      "bbox": {
        "lon1": 13.088345,
        "lat1": 52.3382448,
        "lon2": 13.7611609,
        "lat2": 52.6755087
      }
    }
  ]
}
Here is an example of using the area parameter to set the city boundaries on the map:
https://maps.geoapify.com/v1/staticmap?style=osm-bright&area=rect:13.088345,52.3382448,13.7611609,52.6755087&width=620&height=877&scaleFactor=2&apiKey=YOUR_API_KEYSet by Markers:
You can also let the API determine the optimal map view by specifying a set of markers. This is useful for highlighting specific points of interest.
https://maps.geoapify.com/v1/staticmap?style=osm-bright&marker=lonlat:13.444635903020838,52.54368370998327;type:awesome;color:%2319b8fc;size:large|lonlat:13.294874873122865,52.569339106142735;type:awesome;color:%2319b8fc;size:large|lonlat:13.506691578393344,52.45351953396397;type:awesome;color:%2319b8fc;size:large|lonlat:13.368514274564063,52.441416422224165;type:awesome;color:%2319b8fc;size:large|lonlat:13.248539968844142,52.485274381673975;type:awesome;color:%2319b8fc;size:large|lonlat:13.376477115052296,52.387725437570566;type:awesome;color:%2319b8fc;size:large|lonlat:13.586567298187589,52.391070210816565;type:awesome;color:%2319b8fc;size:large|lonlat:13.263211103275182,52.444552119159425;type:awesome;color:%2319b8fc;size:large&width=620&height=877&scaleFactor=2&apiKey=YOUR_API_KEYIn this example, the markers parameter includes multiple locations, and the map view adjusts to ensure all markers are visible.
Set by Geometry:
The API can also automatically set the map view based on specified geometries, such as routes or polygons. This is particularly useful for maps that need to display a specific path or area.
https://maps.geoapify.com/v1/staticmap?style=osm-bright&geometry=polyline:13.378398,52.529197,13.378301,52.529193,13.378255,52.529188,13.378215,52.529183,13.377886,52.529083,13.377829,52.529067,13.377758,52.529047,13.377711,52.529036,13.377667,52.529027,13.377604,52.529102,13.377575,52.529133,13.377549,52.529161,13.37746,52.529255,13.377373,52.529346,13.377064,52.529672,13.376912,52.529832,13.376291,52.530497,13.376126,52.530665,13.375889,52.530909,13.375879,52.530919,13.375728,52.531078,13.375665,52.531144,13.375807,52.531197,13.375953,52.53125,13.376443,52.531431,13.376489,52.531448,13.376597,52.531487,13.376632,52.5315,13.376921,52.531607,13.377051,52.531655,13.377811,52.531935,13.378086,52.532036,13.378247,52.532096,13.378493,52.532187,13.379239,52.532461,13.380038,52.532756,13.380128,52.532788,13.380238,52.53283,13.380309,52.532773,13.380343,52.532745,13.380415,52.532687,13.380459,52.532652,13.380704,52.532457,13.381485,52.531832,13.381513,52.531755,13.381555,52.531721,13.381563,52.531714,13.381585,52.531696,13.381597,52.531686,13.38172,52.531589,13.381835,52.531551,13.382065,52.531367,13.382099,52.53134,13.382194,52.531263,13.38234,52.531148,13.382504,52.531016,13.382543,52.530943,13.382589,52.530906,13.382679,52.530835,13.38275,52.530779,13.382779,52.530757,13.382789,52.530749,13.382838,52.530727,13.38289,52.530711,13.382905,52.530699,13.383063,52.530576,13.383071,52.530567,13.383107,52.53054,13.383224,52.53045,13.383231,52.530444,13.383266,52.530409,13.383302,52.530378,13.383438,52.530259,13.383467,52.530234,13.383561,52.530158,13.383637,52.530097,13.383926,52.529864,13.384111,52.529714,13.384241,52.529612,13.384567,52.529354,13.384644,52.529292,13.38514,52.528905,13.385381,52.528714,13.386036,52.528175,13.386107,52.528117,13.386331,52.527931,13.386345,52.52792,13.386355,52.527893,13.386388,52.5278,13.386579,52.527631,13.386745,52.527436,13.386873,52.527284,13.386897,52.527256,13.386982,52.527137,13.387048,52.527021,13.387128,52.526487,13.387144,52.526374,13.387156,52.526291,13.387198,52.52602,13.387229,52.525847,13.38726,52.525667,13.387312,52.525354,13.387371,52.525007,13.387392,52.524881,13.387414,52.524753,13.387417,52.52474,13.387486,52.524358,13.38753,52.524045,13.387535,52.524011,13.387568,52.523863&width=620&height=877&scaleFactor=2&apiKey=YOUR_API_KEYIn this example, the geometry parameter defines a route, and the map view adjusts to include the entire geometry.
By utilizing these options, you can ensure your map includes all necessary elements and is centered correctly, providing a comprehensive and visually appealing representation for your printable map.
Step 3: Styling the Map Image
Styling your map image is a key step in creating an attractive and functional printable map. The Static Maps API allows you to choose from a variety of standard map styles or customize the vector map styles to suit your specific needs.
We offer both raster and vector map styles, but we highly recommend using vector map styles for printable maps due to their superior scalability and quality. To explore the available map styles in more detail, please refer to our Maps Documentation.
If you want to learn more about map tile types be sure to check our Raster vs Vector Map Tiles article.
Customizing Vector Map Styles
For more control over the appearance of your map, you can customize vector map styles. Customization Options:
- Show/Hide Lines: Control the visibility of roads, borders, and other linear features.
- Show/Hide Areas: Show or hide parks, water bodies, and other area features.
- Change Colors: Customize the colors of various map elements to match your design preferences.
- Change Line Width: Adjust the width of roads and other linear features for better visibility.
- Modify Labels: Show or hide labels for different map elements, or change their appearance.
The exact customization values depend on the map style, and you will need to work with map layers to achieve the desired effect. Fortunately, our Static Maps Playground allows you to modify the map styles and generate the required parameters.
Example of Customized Map Style:
Here is an example of a customized map style using the Geoapify Static Maps API. This example demonstrates how to adjust various map features like land cover, water, roads, and buildings, as well as modifying label visibility and colors:
https://maps.geoapify.com/v1/staticmap?style=toner-grey&width=1476&height=1476¢er=lonlat:-15.436474,28.131711&zoom=14.5596&styleCustomization=landcover_grass_fill:%23ac32e9|water:%23493454|road_secondary:%238e7a99;2|road_primary:%23702497|road_highway_casing:%23e1e1e1;8|road_highway:%23806291;3|building_fill:%231a131e|building_pattern:%23dde6d4|road_label_primary:none|road_label_secondary:none|place_label_city:%23ec8001;73&scaleFactor=2&apiKey=b8568cb9afc64fad861a69edbddb2658Here is the resulting map image:
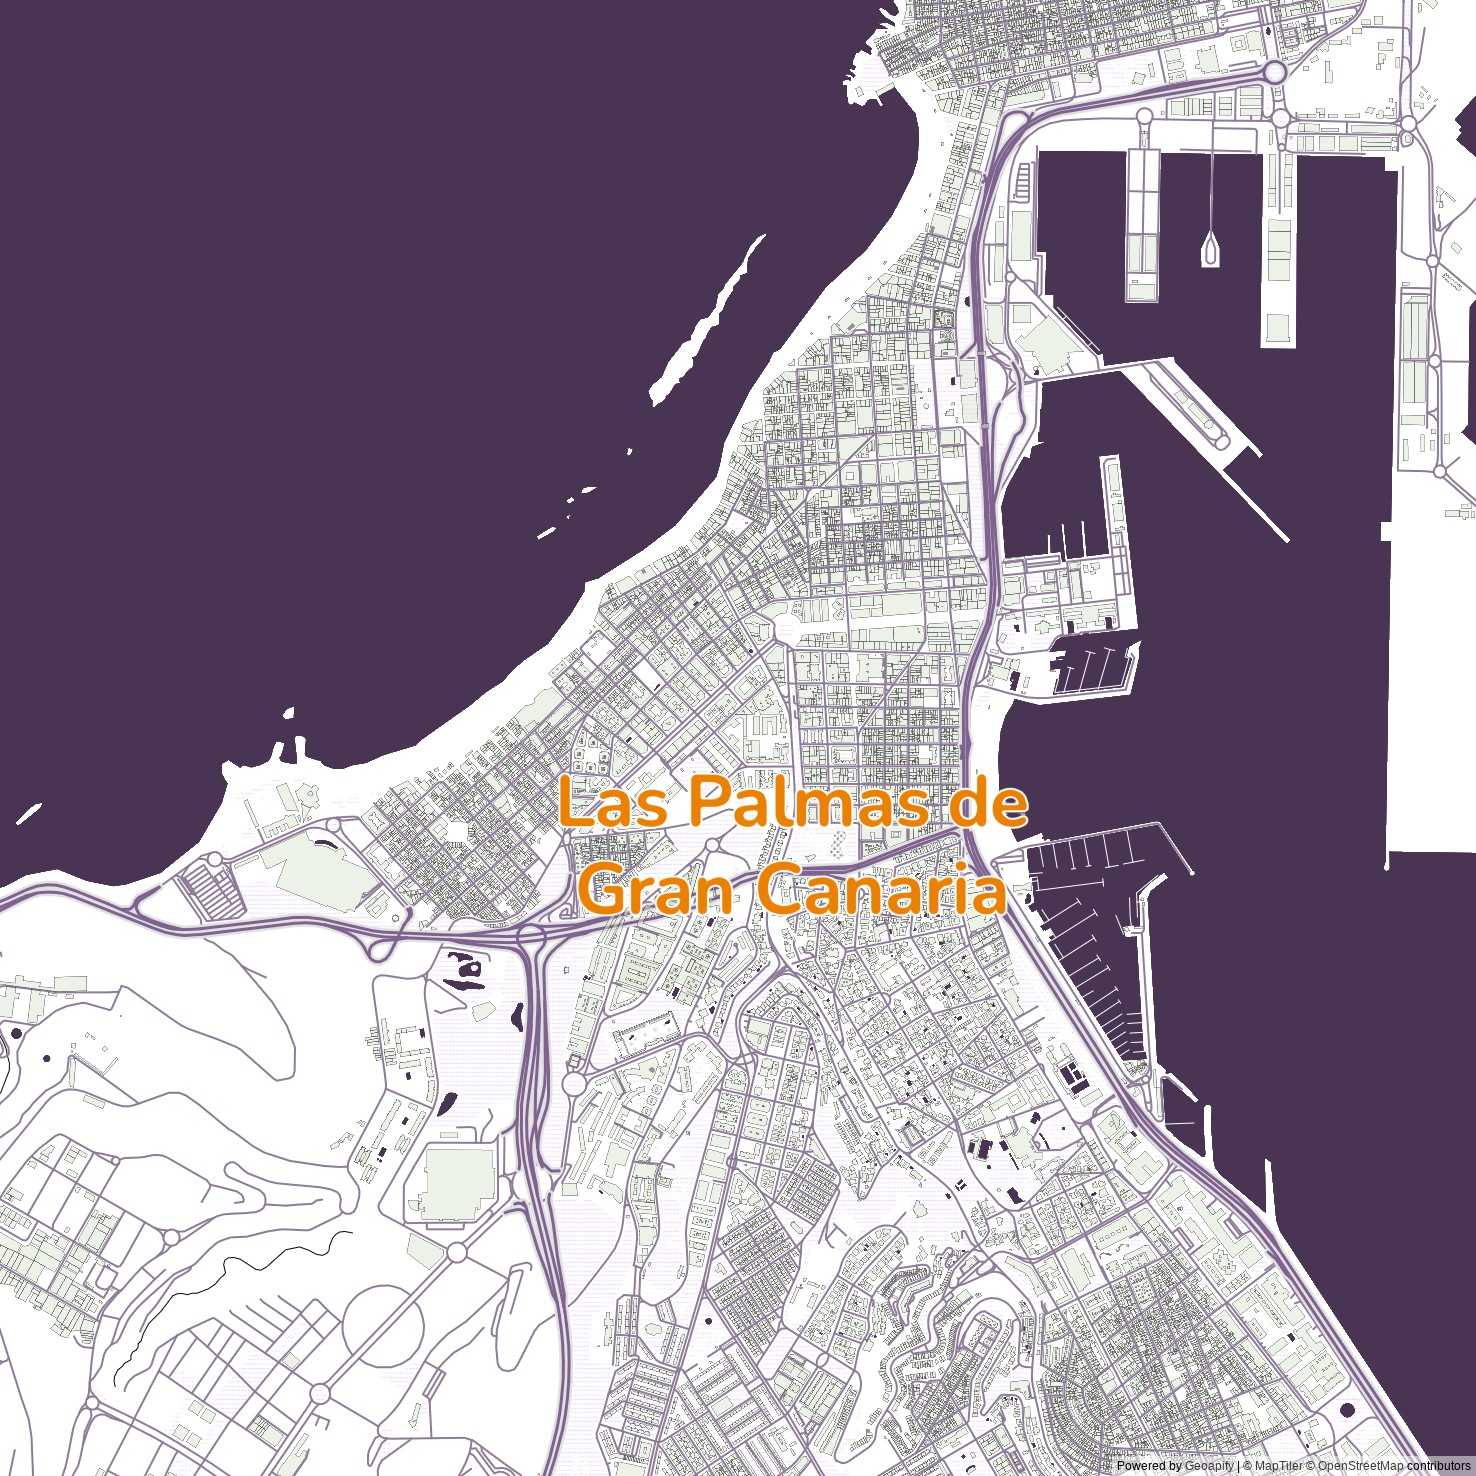
Customization Breakdown:
- landcover_grass_fill: Changes the color of grass areas to #ac32e9.
- water: Sets the water color to #493454.
- road_secondary: Adjusts the secondary road color to #8e7a99 with a width of 2.
- road_primary: Sets the primary road color to #702497.
- road_highway_casing: Changes the casing color of highways to #e1e1e1 with a width of 8.
- road_highway: Sets the highway color to #806291 with a width of 3.
- building_fill: Changes the fill color of buildings to #1a131e.
- building_pattern: Sets the building pattern color to #dde6d4.
- road_label_primary: Hides primary road labels.
- road_label_secondary: Hides secondary road labels.
- place_label_city: Changes the city label color to #ec8001 with a font size of 73.
By utilizing these styling options and the Playground, you can create a map that is not only functional but also visually appealing and tailored to your specific needs. Whether you choose a standard style or customize your own, the Static Maps API provides the flexibility to design the perfect map for printing.
Tips for Creating Beautiful Maps for Print
Creating aesthetically pleasing and functional maps for print involves careful consideration of colors, styles, and details. Here are some tips to help you design beautiful maps:
- Choose a Clean and Simple Style
- Less is More: Avoid cluttering the map with too many details. Focus on the most important elements.
- Minimal Labels: Reduce the number of labels to avoid overcrowding. Use larger font sizes for significant locations.
- Consistent Colors: Use a consistent color palette throughout the map to ensure a harmonious look.
- Use Contrasting Colors
- Background Colors: Choose colors that provide good contrast with map elements to ensure readability.
- Water Bodies: Use blue shades for water features to make them easily recognizable (e.g., #a0d3e8).
- Parks and Green Areas: Use green shades for parks and natural areas (e.g., #a8d5ba).
- Roads: Use neutral colors for roads and highways to ensure they stand out against the background. For example, primary roads can be gray (#707070) and highways a darker gray (#333333).
- Buildings: Choose colors that make buildings distinguishable but not overpowering (e.g., #d3d3d3).
- Highlight Important Features
- Markers and Icons: Use bright, contrasting colors for markers and icons to highlight points of interest (e.g., red, orange).
- Borders: Use slightly darker shades or different colors to highlight borders and boundaries.
- Text Labels: Use contrasting colors for text labels to ensure readability (e.g., black, dark gray).
By following these tips and experimenting with different styles and colors, you can create beautiful, high-quality maps that are both functional and visually appealing. Whether you're designing a city map, a tourist guide, or an educational resource, these guidelines will help you achieve the best results for print.
Conclusion
Creating high-quality printable maps using the Static Maps API is both a practical and creative process. By understanding standard paper sizes and resolutions, effectively choosing and customizing map views, and carefully styling your map images, you can produce professional and visually appealing maps for a variety of purposes. Utilizing tools like the Static Maps Playground can greatly enhance your ability to fine-tune map styles and achieve the desired look.
Remember to use contrasting colors to ensure readability and to consider the specific needs and context of your map to highlight the most important features. With these tips and techniques, you are well-equipped to design beautiful and functional maps ready for print.