


With the help of the Routing API (Directions API), you can calculate distances, times, and routes between multiple locations and return them to your application. Moving on, let's see how to visualize the route on a map.
It's relatively simple to visualize routes on maps. Most map libraries provide the functionality "out of the box," so to speak. However, some tricks can improve your implementation.
In this tutorial, we'll learn how to display the Geoapify Routing API routes on a MapLibre GL (Mapbox) map:
- Draw a GeoJSON with MapLibre GL(Mapbox GL)
- Show layer data in a popup with MapLibre GL(Mapbox GL)
- JSFiddle live demo: draw a route on a map
What kind of route data can I visualize on a map?
When using Geoapify Routing, besides a route geometry, you get a lot of helpful information, such as turn-by-turn instructions, time/distance values, tolls, ferries, and more. In addition, you can request route details and get information about speed limits, road surface, road classes, lane number, etc.
When we talk about route visualization, we are not simply talking about a line on a map. It also informative line styling, map markers, and popups showing the data:
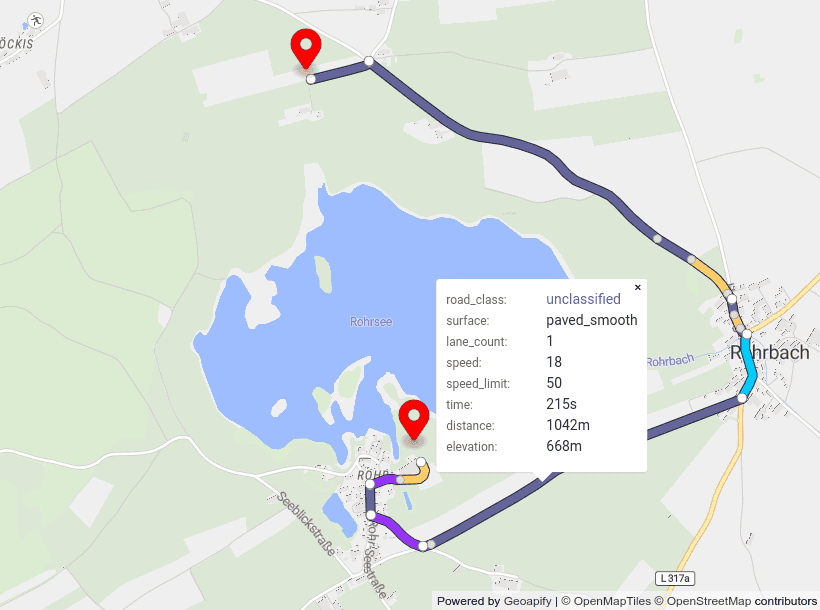
The route visualization details vary by travel mode. For example, the road classes are essential for truck routes, and elevation information and read surfaces are vital for hiking or mountain biking route.
Despite the many variations of route visualization, the basic principles remain the same. So let's go further and learn MapLibre GL (Mapbox GL) features and functions useful for the drawing routes.
Draw routes as a GeoJSON with MapLibre GL (Mapbox GL)
Geoapify returns results in different formats, including JSON, GeoJSON, and XML. Some formats may be more convenient than others depending on the use case. When you want to visualize your data on a map, GeoJSON is the format to use.
GeoJSON format and how to use it
GeoJSON is a data format developed specifically for spatial data and geographical coordinates. It allows describing points, lines, and polygons in the same way. And it's natively supported by most map libraries, including MapLibre GL.
Here is an example of a GeoJSON object returned by Geoapify Routing API:
- [] 1 item▶
- {} 3 keys▶
- "Feature"
- {} 8 keys▶
- {} 2 keys▶
- {} 4 keys▶
- "bicycle"
- [] 2 items▶
- "metric"
- [] 1 item▶
- "FeatureCollection"
You can see that the Geoapify Routing returns a FeatureCollection object. Each feature in features property corresponds to a requested route. One response can have a few alternative routes when requested. By default, the Routing API returns a single route so that you can address it as feature[0].
GeoJSON objects in MapLibre GL (Mapbox GL)
A GeoJSON object can be added to our MapLibre GL map as a Map Source and displayed as a Map Layer.
The map sources contain the data, and the map layers describe how to visualize the data. Each data layer is associated with one particular data source. So you need to add sources before adding the layers and removing layers before removing sources.
You can add map sources, change source data, add/remove map layers. Here are MapLibre GL functions that you can use for that:
- addSource(sourceId, sourceData) - add a new source, for example, containing GeoJSON data:
map.addSource("my-route", {
  "type":"geojson",
  "data": geoJSONData // <= add data here!
});- getSource(sourceId).setData(geoJSONData) - set GeoJSON data to an existing source:
map.getSource("my-route").setData(geoJSONData /* set data here!*/);- removeSource(sourceId) - remove a source from the map:
map.removeSource("my-route");- addLayer(layerData, beforeLayerId?) - add a new layer of Mapbox Style Specification type
map.addLayer({
  id: 'my-route-layer',
  source: 'my-route',
  type: 'line',
  ...
});- removeLayer(layerId) - remove the layer with the ID provided
if (map.getLayer('my-route-layer')) map.removeLayer('my-route-layer');When your route depends on user input and can change during the application's execution, you need to update your source data and recreate layers to change how the app displays the route:
function updateRoute(routeJSON, updateLayers) {
  if (map.getSource('my-route')) {
    // update source data
    map.getSource("my-route").setData(geoJSONData);
  } else {
    // create a new source
    map.addSource("my-route", {
      "type":"geojson",
      "data": geoJSONData
    });
  }

  if (map.getLayer('my-route-layer') || updateLayers) {
    // remove the previous version of layer
    if (map.getLayer('my-route-layer')) {
      map.removeLayer('my-route-layer');
    }

    map.addLayer({
      id: 'my-route-layer',
      source: 'my-route',
      type: 'line',
      ...
    });
  }
}
Style GeoJSON layers
MapLibre GL layers correspond to Mapbox GL Style specifications. The Style specifications describe the paint and layout properties used to visualize the data of different layer types - line, circle, fill, etc.
To visualize a route, you'll need to use a line layer. Here are some examples of line layers:
Colored line in MapLibre GL (Mapbox GL)
map.addLayer({
  id: 'my-route-layer',
  source: 'my-route',
  type: 'line',
  layout: {
    'line-cap': "round",
    'line-join': "round"
  },
  paint: {
    'line-color': "#6084eb",
    'line-width': 8
  }
});
Dashed line layer in MapLibre GL (Mapbox GL)
map.addLayer({
  id: 'my-route-layer',
  source: 'my-route',
  type: 'line',
  layout: {
    'line-cap': "round",
    'line-join': "round"
  },
  paint: {
    'line-color': "#6084eb",
    'line-width': 2,
    'line-dasharray': [1, 2],
  }
});
In addition, you can use circle layers to visualize positions corresponding to turn-by-turn or directions instructions:
map.addLayer({
  id: 'points-layer',
  type: 'circle',
  source: 'points',
  paint: {
    'circle-radius': 4,
    'circle-color': "#fff",
    'circle-stroke-color': "#aaa",
    'circle-stroke-width': 1,
  }
});
Draw a route on the map
You can show a route on the map as a line in a specific color or pattern. You can add more than one layer per route line. For example, you can make the route's line more visible by using an additional layer as an outline:
// add outline layer
map.addLayer({
  id: 'my-route-layer-outline',
  type: 'line',
  source: 'my-route', // <= the same source id
  layout: {
    'line-cap': "round",
    'line-join': "round"
  },
  paint: {
    'line-color': "#212d4f",
    'line-width': 10
  }
});

// add route layer
map.addLayer({
  id: 'my-route-layer',
  type: 'line',
  source: 'my-route', // <= the same source id
  layout: {
    'line-cap': "round",
    'line-join': "round"
  },
  paint: {
    'line-color': "#6084eb",
    'line-width': 8
  }
});
It's also possible to draw route segments and color them according to the road properties, for example, road class or road surface. You can get route details by adding the' details' parameter to the Routing API URL.
You can extract route segments data from Geoapify Route object and combine them to a new GeoJSON object this way:
const steps = [];
routeGeoJSONData.features[0].properties.legs.forEach((leg, legIndex) => {
  const legGeometry = routeData.features[0].geometry.coordinates[legIndex];
  leg.steps.forEach((step, index) => {
    if (step.from_index === step.to_index) {
      // destination point
      return;
    }

    const stepGeometry = legGeometry.slice(step.from_index, step.to_index + 1);

    // create a new GeoJSON Feature object
    steps.push({
      "type": "Feature",
      "geometry": {
        "type": "LineString",
        "coordinates": stepGeometry
      },
      properties: step
    });
  });
});

const routeStepsGeoJSONData = {
  type: "FeatureCollection",
  features: steps
}
Then add the GeoJSON and corresponding layers by doing the following:
map.getSource('my-route').setData(routeStepsGeoJSONData);
map.addLayer({
  id: 'route-layer',
  type: 'line',
  source: 'my-route',
  layout: {
    'line-join': "round",
    'line-cap': "round"
  },
  paint: {
    'line-color': [ // => using feature-state expression, that checks feature.properties.road_class value
      'match',
      ['get', 'road_class'],
      'motorway',
      '#009933',
      'trunk',
      '#00cc99',
      'primary',
      '#009999',
      'secondary',
      '#00ccff',
      'tertiary',
      '#9999ff',
      'residential',
      '#9933ff',
      'service_other',
      '#ffcc66',
      'unclassified',
      '#666699',
      /* other */
      '#666699'
    ],
    'line-width': 8
  }
});
Here is an example of how you can add step-by-step instructions to your route visualization:
routeData.features[0].properties.legs.forEach((leg, legIndex) => {
  const legGeometry = routeData.features[0].geometry.coordinates[legIndex];
  leg.steps.forEach((step, index) => {
    if (step.instruction) {
      // create a new GeoJSON Feature object of Point type
      instructions.push({
        "type": "Feature",
        "geometry": {
          "type": "Point",
          "coordinates": legGeometry[step.from_index]
        },
        properties: {
          text: step.instruction.text
        }
      });
    }
  });
});

instructionsGeoJSONData = {
  type: "FeatureCollection",
  features: instructions
}

map.getSource('points').setData(instructionsGeoJSONData);
map.addLayer({
  id: 'points-layer',
  type: 'circle',
  source: 'points',
  paint: {
    'circle-radius': 4,
    'circle-color': "#fff",
    'circle-stroke-color': "#aaa",
    'circle-stroke-width': 1
  }
});
Show route data in a popup with MapLibre GL (Mapbox GL)
MapLibre GL library lets you add popups to your map with custom data. The popup may contain just text, or may have custom HTML code. This feature makes it possible to provide helpful information about the route, such as road properties and direction instructions.
Show popup on the route click or hover
MapLibre GL allows you to add mouse event listeners to layers for 'click', 'double-click', 'mouseenter', 'mouseover', 'mouseleave', and more. The event object passed into the event listener function contains the feature object. You can access an object's properties and display them in a popup.
To add a map event on layer, do the following:
map.on('mouseenter', 'my-route-layer', () => {
  map.getCanvas().style.cursor = 'pointer';
});

map.on('mouseleave', 'my-route-layer', () => {
  map.getCanvas().style.cursor = '';
});

map.on('click', 'my-route-layer', (e) => {
  const featureData = e.features[0].properties;
})
MapLibre GL lets you create several Popup objects. However, to avoid performance issues, we recommend creating a single Popup object per map.
The code below demonstrates how to show route layer properties in a popup:
const popup = new maplibregl.Popup();

map.on('click', 'route-layer', (e) => {
  showPopup({
    distance: `${e.features[0].properties.distance} m`,
    time: `${e.features[0].properties.time} s`
  }, e.lngLat);
  e.preventDefault();
});

function showPopup(data, lngLat) {
	let popupHtml = Object.keys(data).map(key => {
  	return `<div class="popup-property-container">
              <span class="popup-property-label">${key}: </span>
              <span class="popup-property-value">${data[key]}</span>
            </div>`
  }).join('');

 	popup.setLngLat(lngLat).setHTML(popupHtml).addTo(map);
}
Style the popup
Customizing the MapLibre GL popup is easy. You can customize the appearance of a popup by providing a class name when creating the object, and you can then style it in your CSS file:
const popup = new maplibregl.Popup({
  className: 'my-map-popup'
});
For detailed information on the Popup object, click here.
Live demo: visualize a route and route segments on a map
We have prepared a demo of the route visualization for you. The demo shows you how to get a route GeoJSON object from Geoapify Routing API and draw the route on the map - the entire route or separate route segments.
The "Show Route Details" toggle button switches the display from the route visualization to the route segments visualization.
You can view the complete example on JSFiddle >>
FAQ
How to add a route on Mapbox GL (MapLibre GL)?
The most direct way to display a route geometry with Mapbox GL (MapLibre GL) is with GeoJSON sources. It's an easy and straightforward format to work with geographical objects. Check the JSFiddle example demonstrating route visualization on a map.
How to add GeoJSON on Mapbox GL (MapLibre GL)?
Mapbox GL (MapLibre GL) natively supports GeoJSON objects. With Mapbox, you can add GeoJSON source and then display data from that source with Map Layers. Here is a JSFiddle example of displaying the Routing API object, the GeoJSON object. In addition, you can see how to add route line layers and turn-by-turn positions as point layers.
How to style GeoJSON in Mapbox GL (MapLibre GL)?
You can visualize GeoJSON data using map layers. As soon as GeoJSON is inside a Mapbox GL (MapLibre GL) map object, it can be styled as a line, fill, circle and other type. Our JSFiddle example shows how to create line and circle map layers for a visualization of a travel route.
How to display info from GeoJSON in popup Mapbox GL (MapLibre GL)?
Add map mouse events to investigate when a user clicks, hovers, etc., a layer that displays GeoJSON. The event object that comes from the event listener contains the GeoJSON feature that was interacted with. So you can create popup content and show it on the map. A JSFiddle example example shows route object properties in a popup on click.
What's next
- Learn more about Routing API >>
- Try the Routing API without registration on the API Playground page >>
- Check the Routing API Documentation >>